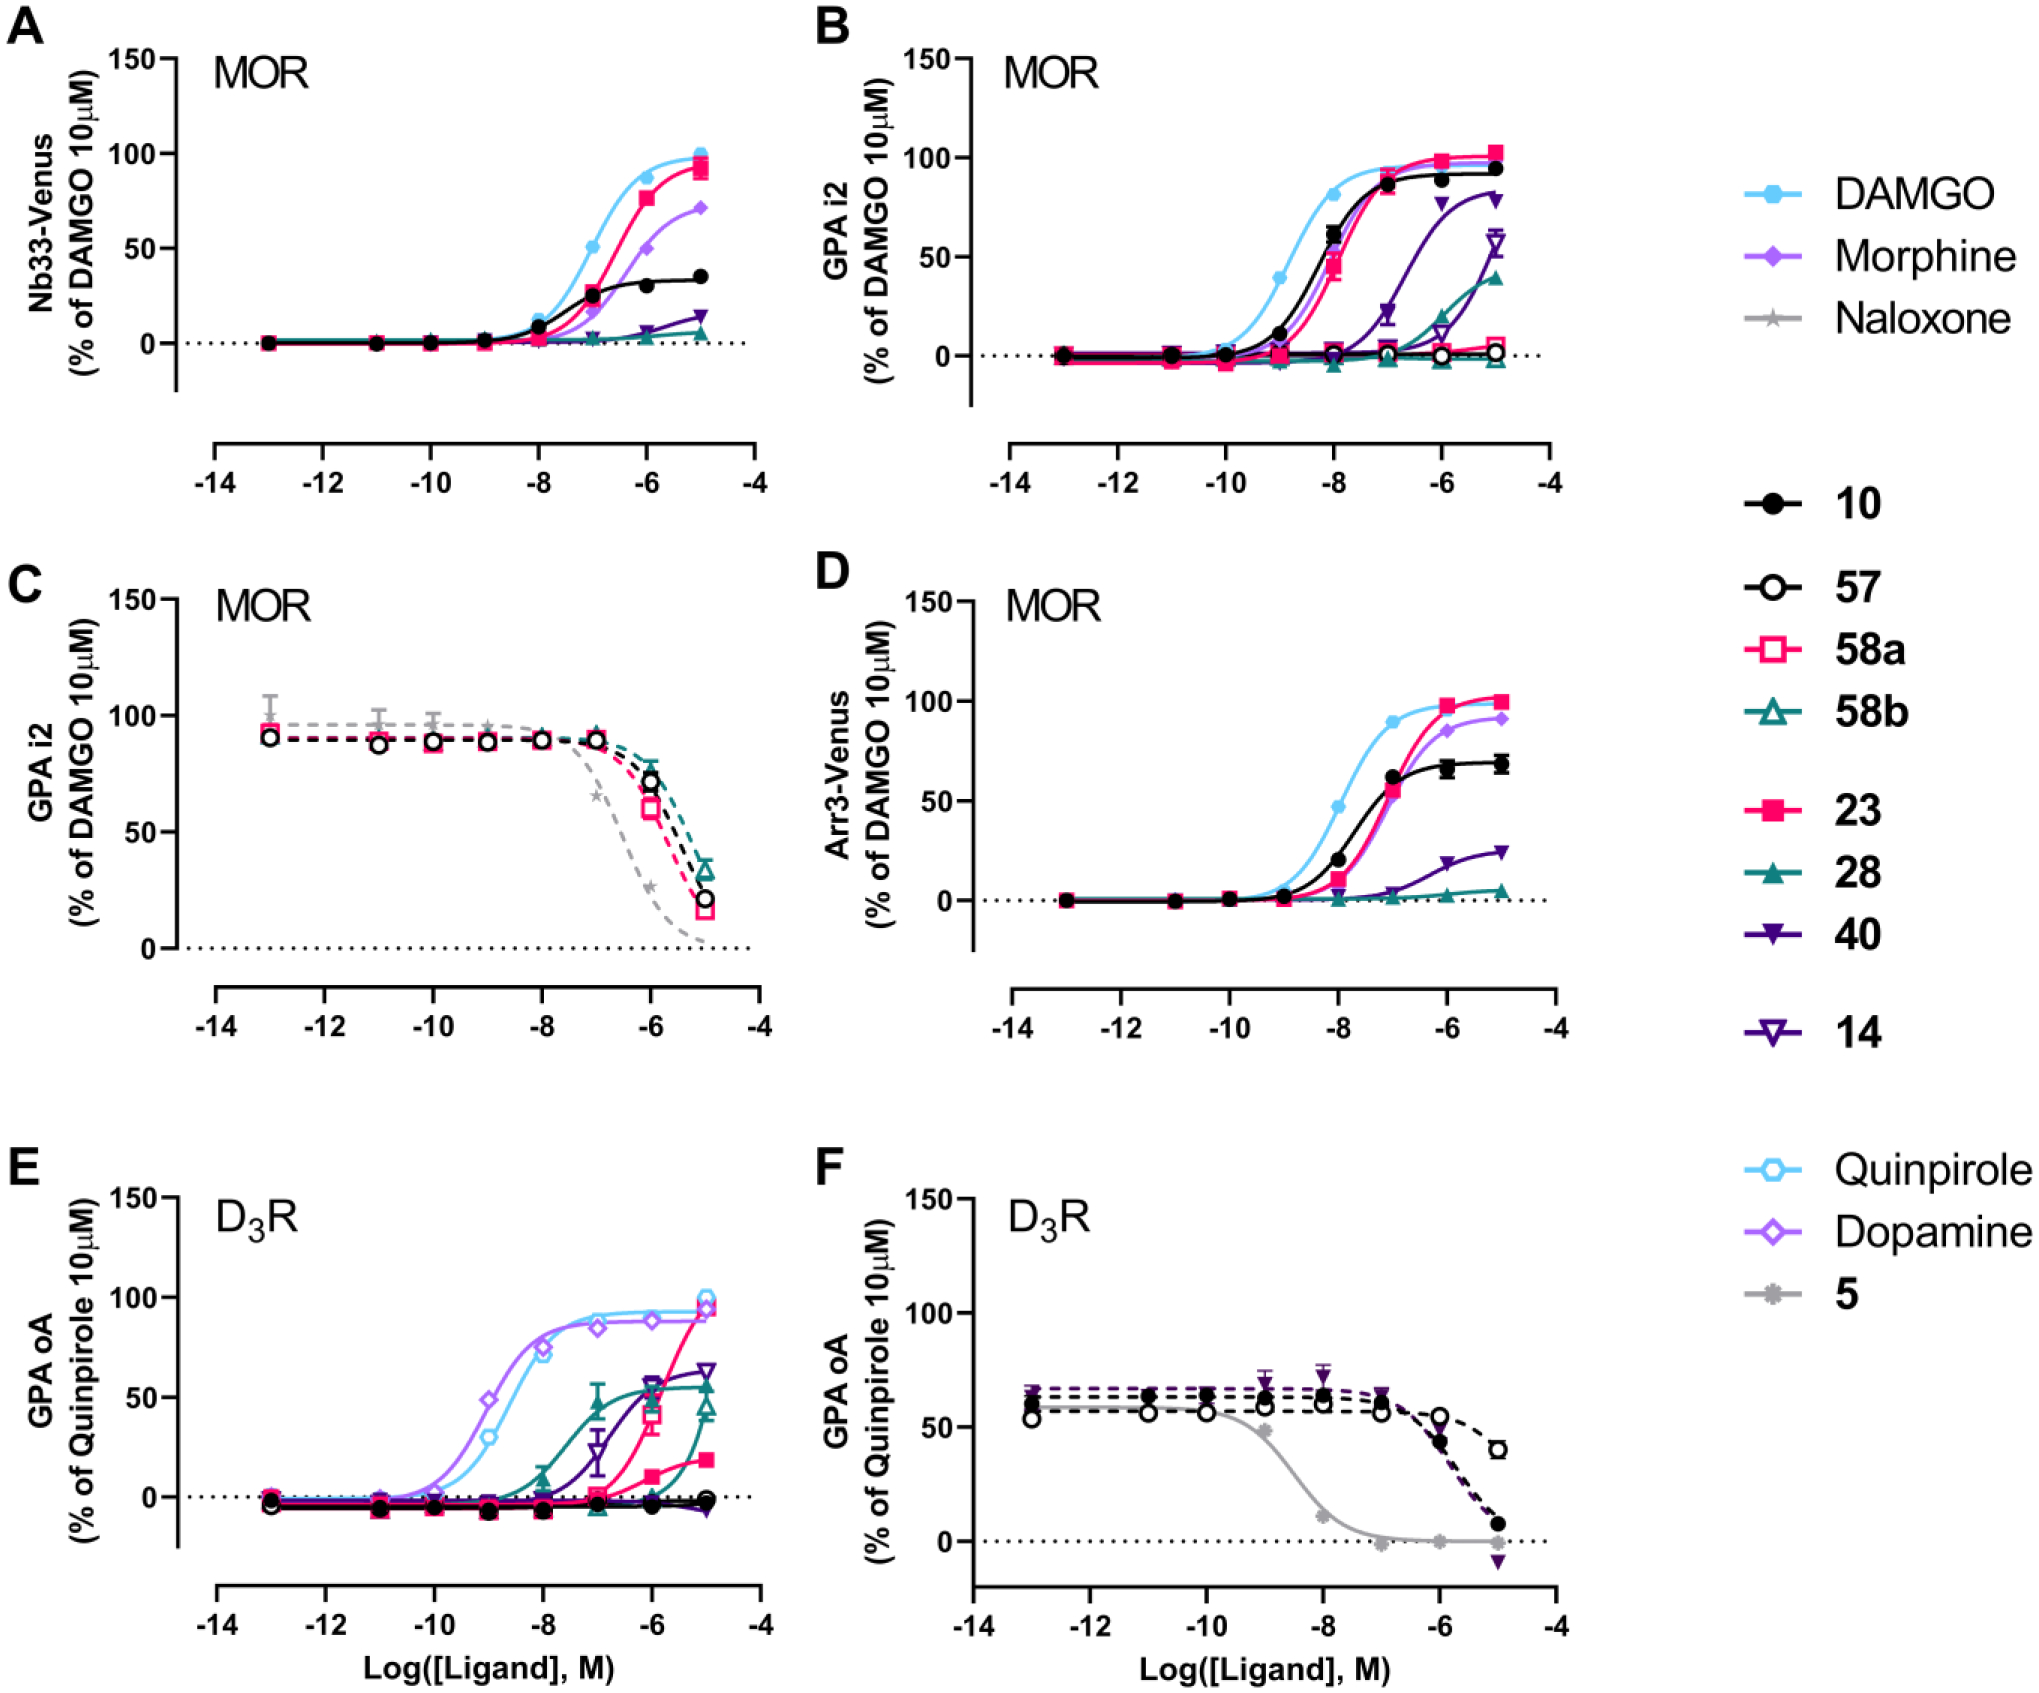
Figure 7. Functional profiles of selected MOR-D3R hybrids.

Each panel shows a different signaling readout: A. Nb33 recruitment at MOR, B. MOR-mediated Gαi2 protein activation, C. Antagonism at MOR using GPA in the presence of 100 nM of DAMGO, D. Arrestin-3 recruitment at MOR in the presence of overexpressed GRK2, E. D3R-mediated GαoA protein activation and F. Antagonism at D3R using GPA in the presence of 3 nM of quinpirole. In order to ensure that test ligands achieved maximal receptor occupancy possible before agonist addition, all ligands were added to the cells 3h prior to activating D3R with quinpirole and measuring BRET signals with the exception of 5. Dotted lines represent fits where the bottom asymptote was constrained to be 0%.
