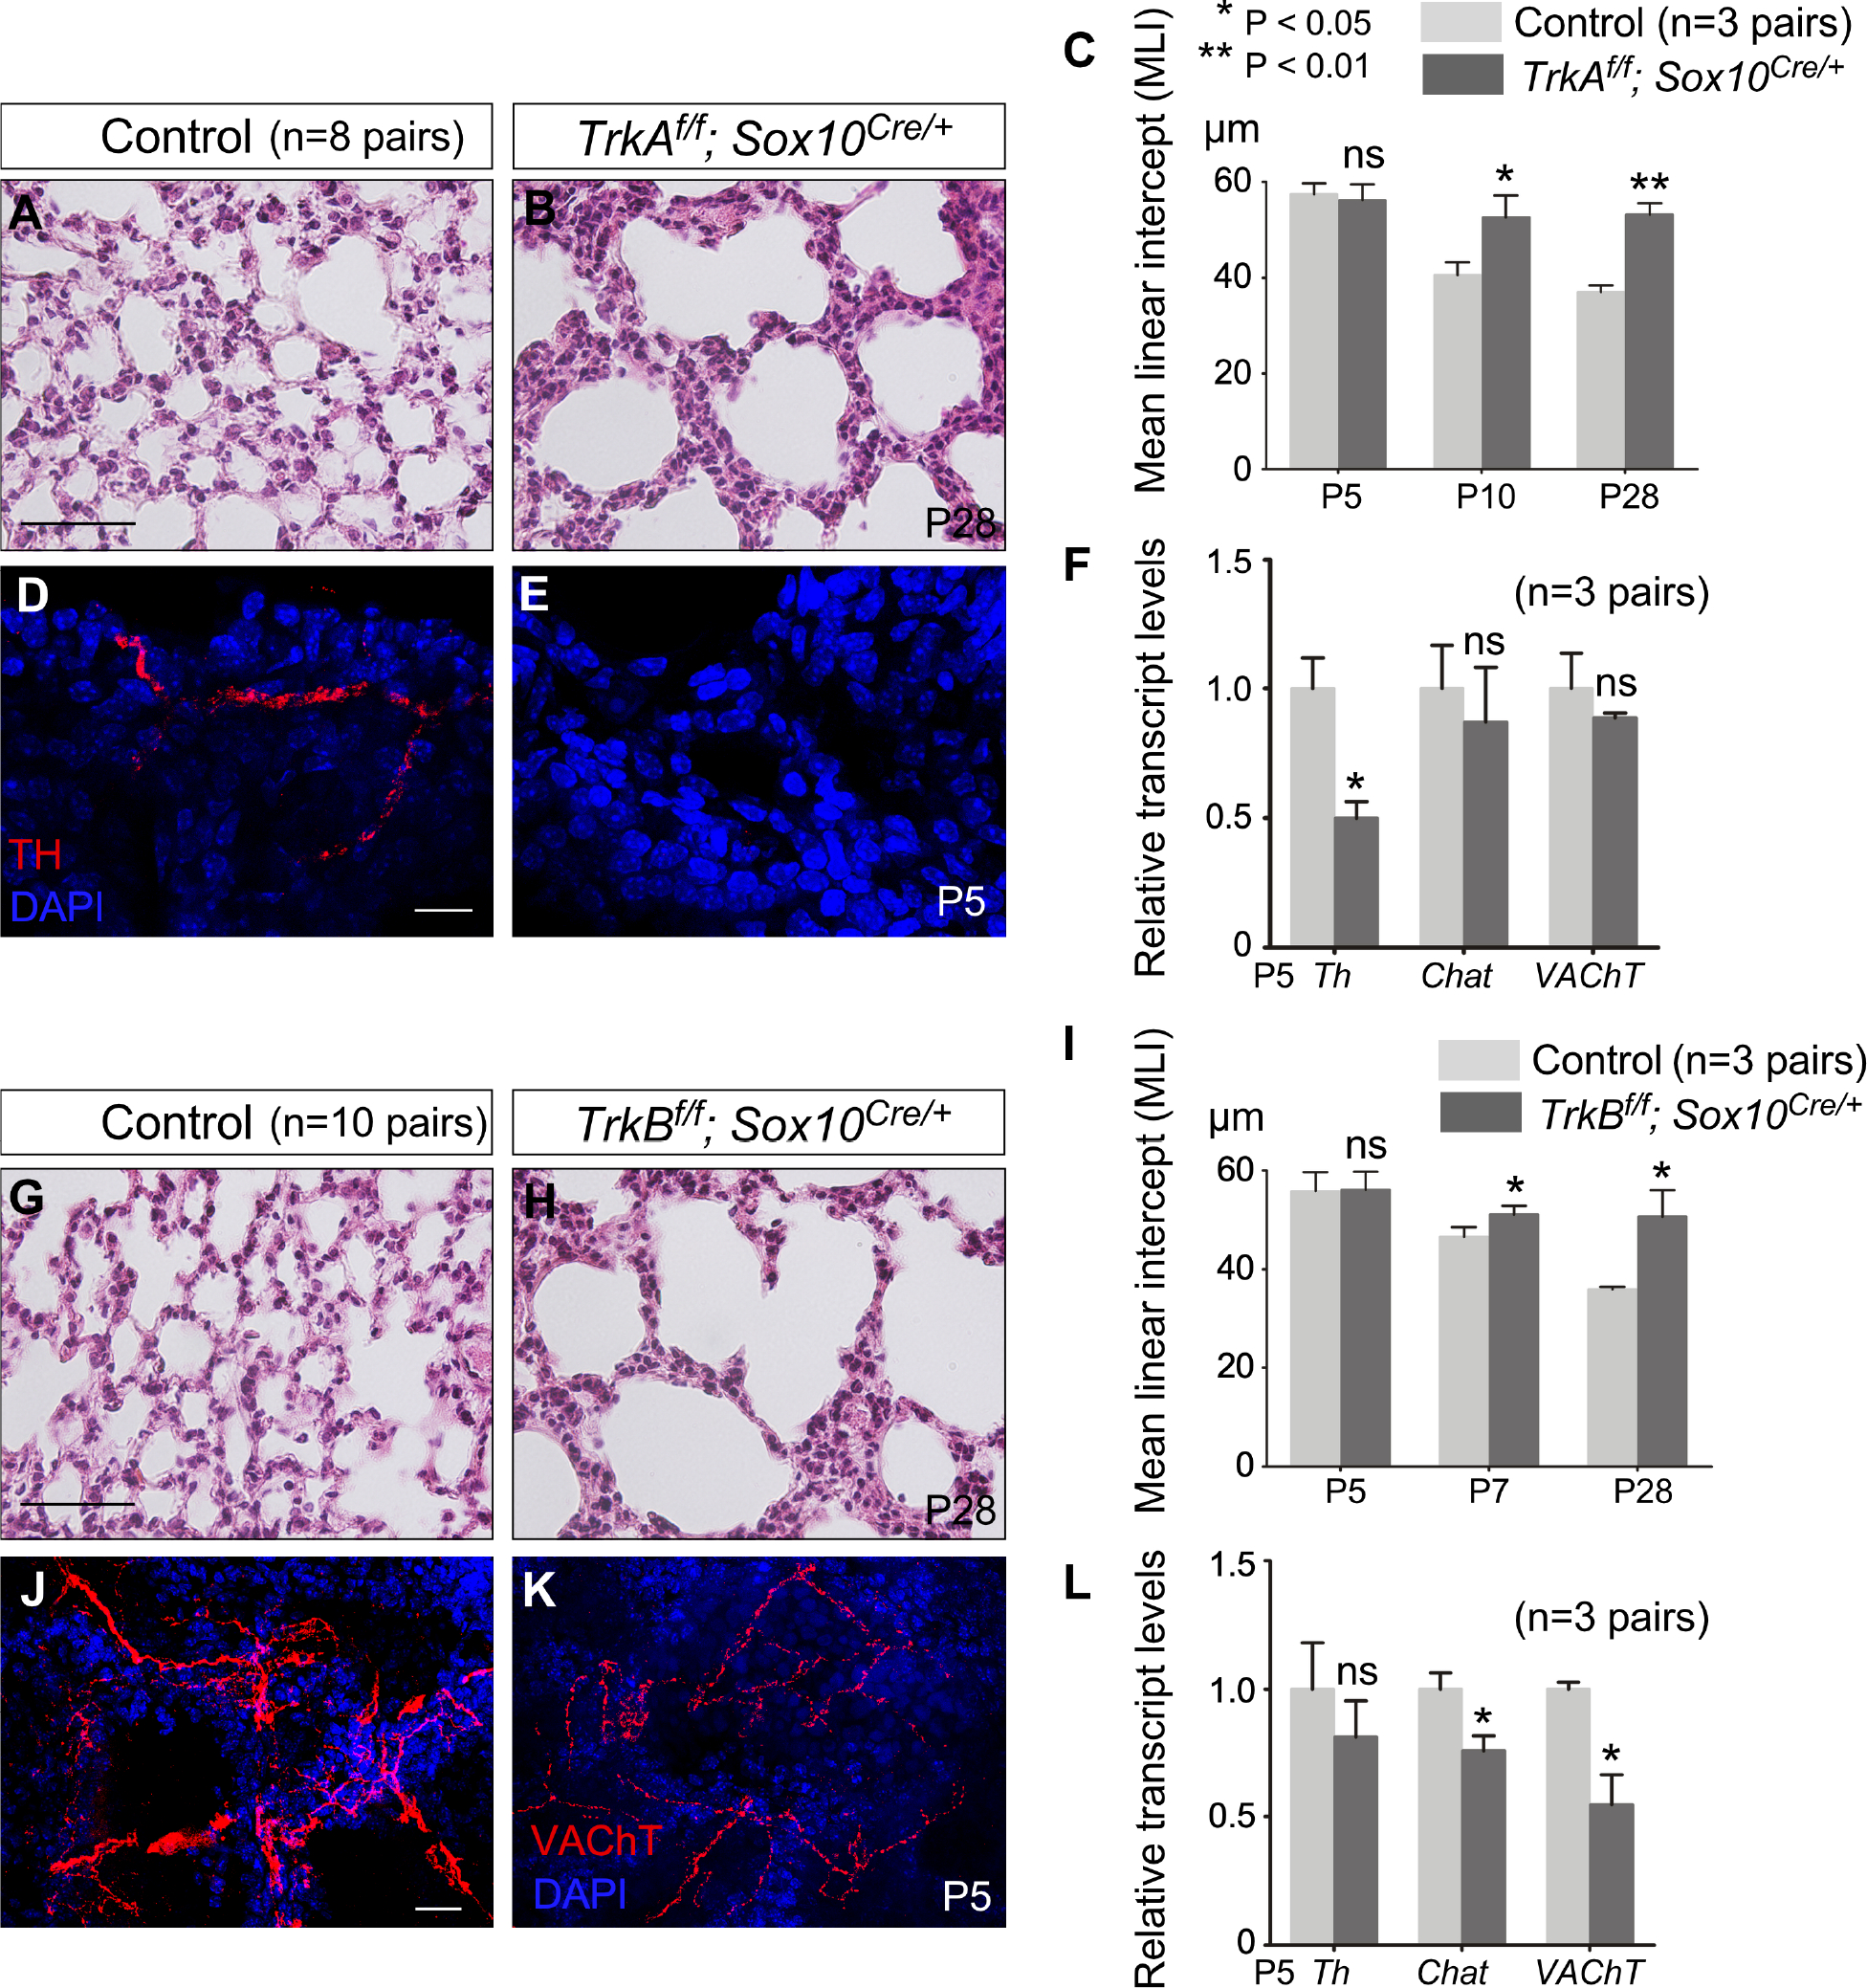
Figure 2. Neurotrophin signaling in autonomic nerves regulates alveolar formation.

(A, B) Hematoxylin-and-eosin (H&E) staining of lung sections from control and TrkAf/f; Sox10Cre/+ mice (n=8 pairs) at postnatal (P) day 28.
(C) Measurement of the mean linear intercept (MLI) of control and TrkAf/f; Sox10Cre/+ lungs (n=3 pairs) at P5, P10 and P28.
(D, E) Immunofluorescence of lung sections from control and TrkAf/f; Sox10Cre/+ mice (n=3 pairs) stained with anti-TH (tyrosine hydroxylase) to label sympathetic nerve fibers at P5.
(F) qPCR analysis of transcript levels in control and TrkAf/f; Sox10Cre/+ lungs (n=3 pairs) at P5. Th expression levels were reduced in TrkAf/f; Sox10Cre/+ lungs compared to controls while the expression levels of Chat and VAChT were unaltered.
(G, H) H&E staining of lung sections from control and TrkBf/f; Sox10Cre/+ mice (n=10 pairs) at P28.
(I) Measurement of the MLI in control and TrkBf/f; Sox10Cre/+ lungs (n=3 pairs) at P5, P7 and P28.
(J, K) Immunofluorescence of lung sections from control and TrkBf/f; Sox10Cre/+ mice (n=5 pairs) stained with anti-VAChT to label parasympathetic nerve fibers at P5.
(L) qPCR analysis of transcript levels in control and TrkBf/f; Sox10Cre/+ lungs (n=3 pairs) at P5. The expression levels of Chat and VAChT were reduced in TrkBf/f; Sox10Cre/+ lungs compared to controls whereas the expression levels of Th were unaltered.
Scale bars, 100 μm (A, B, G, H), 10 μm (D, E), 25 μm (J, K). All values are mean ± SEM. (*) p<0.05; (**) p<0.01; ns, not significant (unpaired Student’s t-test).
