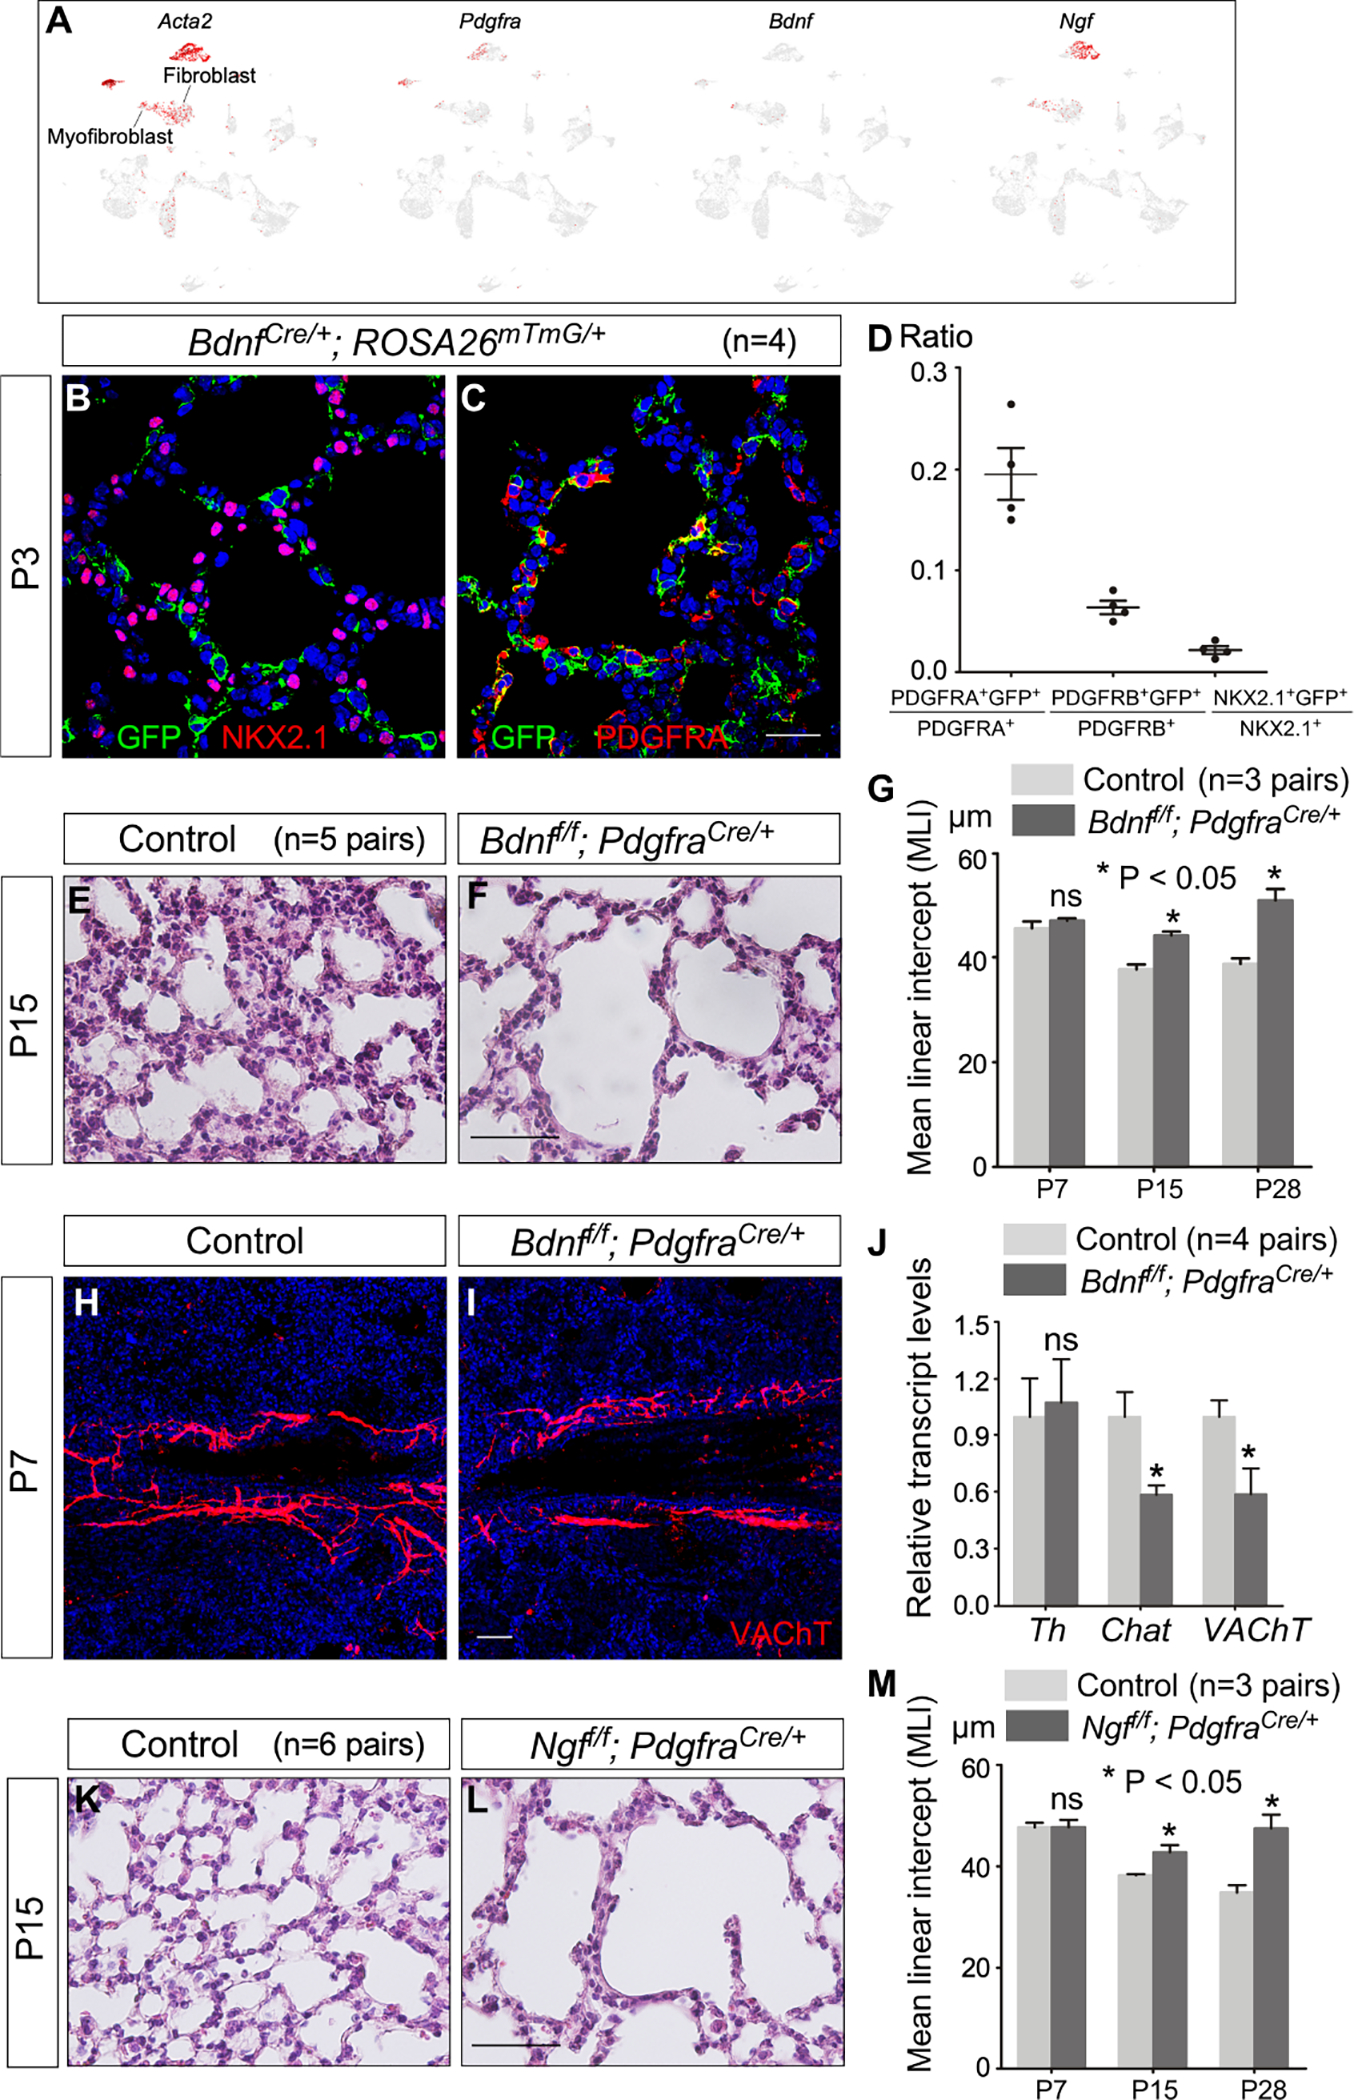
Figure 8. Alveolar fibroblasts/myofibroblasts are essential for neural function during alveologenesis.

(A) Single-cell RNA-seq (scRNA-seq) analysis of mouse distal lung cells. UMAP plots of cell clusters that expressed Acta2, Pdgfra, Bdnf and Ngf across all cell clusters, darker red indicating higher relative expression. Bdnf and Ngf were also expressed in airway smooth muscle and vascular smooth muscle cells, two known sites of neurotrophin production. We also noted the incomplete nature of the existing scRNA-seq data. For instance, Ngf is not detected in any lung cell types by the publicly available scRNA-seq (LungMAP). Interestingly, Ngf-LacZ signal in the lungs of NgfLacZ/+ mice was high in pulmonary neuroendocrine cells (PNECs).
(B, C) Immunofluorescence of lung sections from BdnfCre/+; ROSA26mTmG/+ mice (n=4 pairs) stained with anti-GFP, anti-NKX2.1 and anti-PDGFRA at P3. NKX2.1 labeled epithelial cells, PDGFRA marked fibroblasts/myofibroblasts and PDGFRB detected pericytes. Of note, removal of Bdnf by Sox9Cre in the lung epithelium did not lead to alveolar defects.
(D) Quantification of the percentage of (myo)fibroblasts, pericytes and epithelial cells labeled by Bdnf-Cre, respectively. Expression of Bdnf-Cre induced GFP expression from ROSA26mTmG/+.
(E, F) Hematoxylin-and-eosin (H&E) staining of lung sections from control and Bdnff/f; PdgfraCre/+ mice (n=5 pairs) at P15.
(G) Measurement of the mean linear intercept (MLI) in control and Bdnff/f; PdgfraCre/+ mice (n=3 pairs) at P7, P15 and P28.
(H, I) Immunofluorescence of lung sections from Bdnff/f; PdgfraCre/+ mice (n=3 pairs) stained with anti-VAChT at P7. VAChT marked parasympathetic nerves.
(J) qPCR analysis of transcript levels in control and Bdnff/f; PdgfraCre/+ lungs (n=4 pairs) at P7. The expression levels of Chat and VAChT were reduced in Bdnff/f; PdgfraCre/+ lungs compared to controls.
(K, L) H&E staining of lung sections from control and Ngff/f; PdgfraCre/+ mice (n=6 pairs) at P15.
(M) Measurement of the MLI in control and Ngff/f; PdgfraCre/+ mice (n=3 pairs) at P7, P15 and P28.
Scale bars, 25 μm (B, C), 100 μm (E, F, K, L), 50 μm (H, I). All values are mean ± SEM. (*) p<0.05; ns, not significant (unpaired Student’s t-test).
