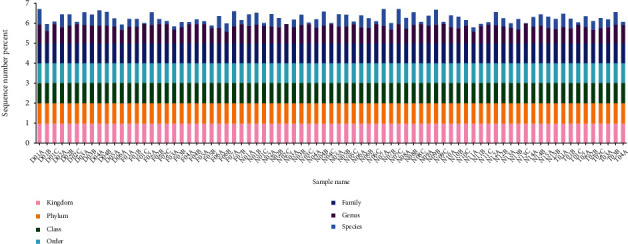
Figure 1.

Histogram of the degree of sequence annotation for each sample at each taxonomic level. The horizontal coordinate is the sample name, and the vertical coordinate indicates the ratio of the number of sequences annotated to that level to the total annotated data (sequence number percent). The top-down color order of the bars corresponds to the color order of the legends on the right. The highest value of 1 for each classification level means that 100% of the sequences were annotated at least at that level.
