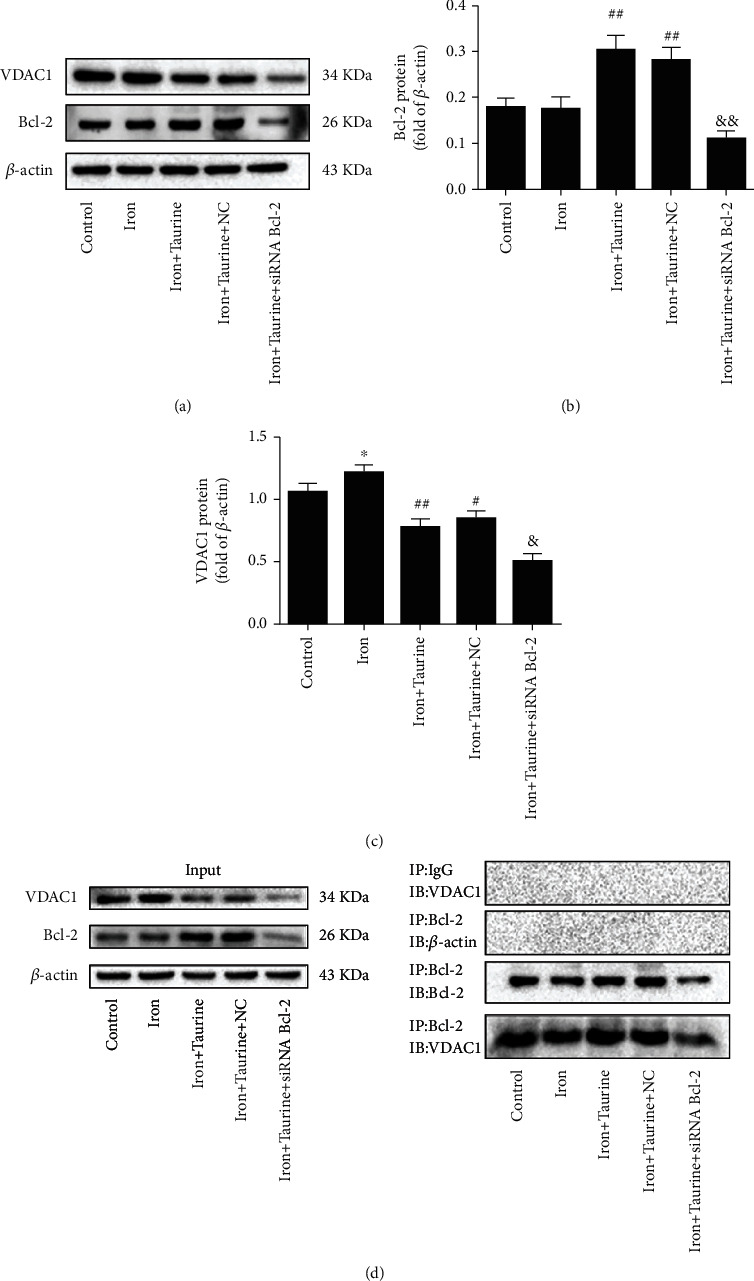
Figure 3.

(a) Western blot analysis was performed to examine the expression level of Bcl-2 and VDAC1 in L02 cells. (b) Bcl-2 protein level in L02 cells. (c) VDAC1 protein level in L02 cells. (d) Coimmunoprecipitation was used to study the interaction between Bcl-2 and VDAC1 in different experimental groups. Data values are expressed as mean ± standard error of the mean (SEM), n = 3. ##P < 0.01 vs. the control group. &&P < 0.01 vs. the iron+taurine group. ∗P < 0.05 vs. the control group. #P < 0.05 and ##P < 0.01 vs. the iron group. &P < 0.05 vs. the iron+taurine group.
