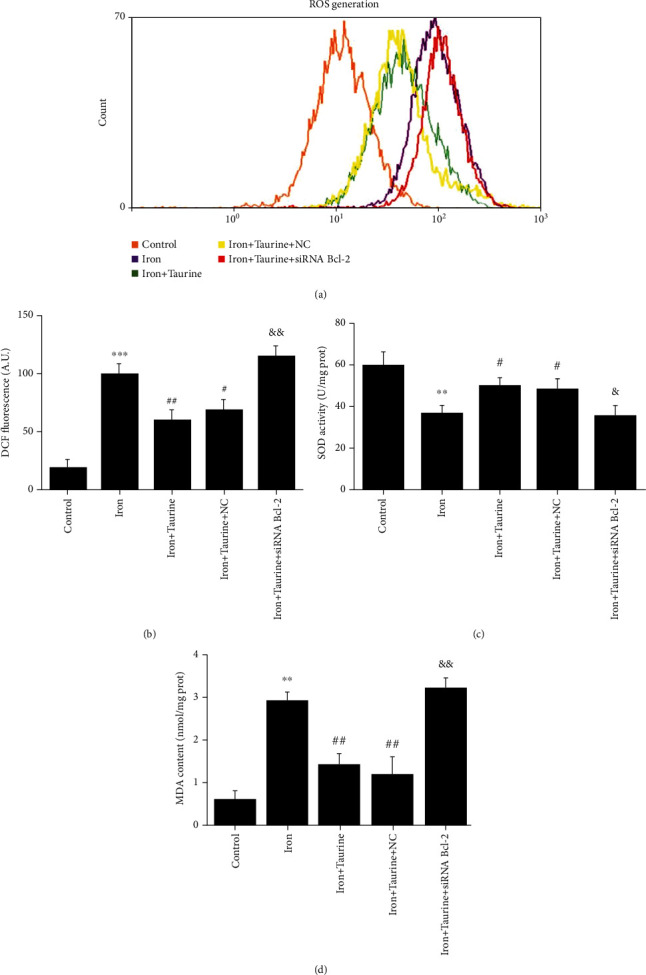
Figure 4.

The effect of taurine treatment on oxidative stress and lipid peroxidation caused by iron overload injury. (a) DCF fluorescence analysis by flow cytometry. (b) Histogram of ROS content, measured as DCF fluorescence. Taurine treatment increases (c) SOD activity and decreases (d) MDA content. Data values are expressed as the mean ± standard error of the mean (SEM) (n = 3). ∗∗∗P < 0.01 vs. the control group. ##P < 0.01 vs. the iron group. &&P < 0.01 vs. the iron+taurine group. ∗∗P < 0.01 vs. the control group. ##P < 0.01 vs. the iron group. &&P < 0.01 vs. the iron+taurine group. #P < 0.05 vs. the iron group.
