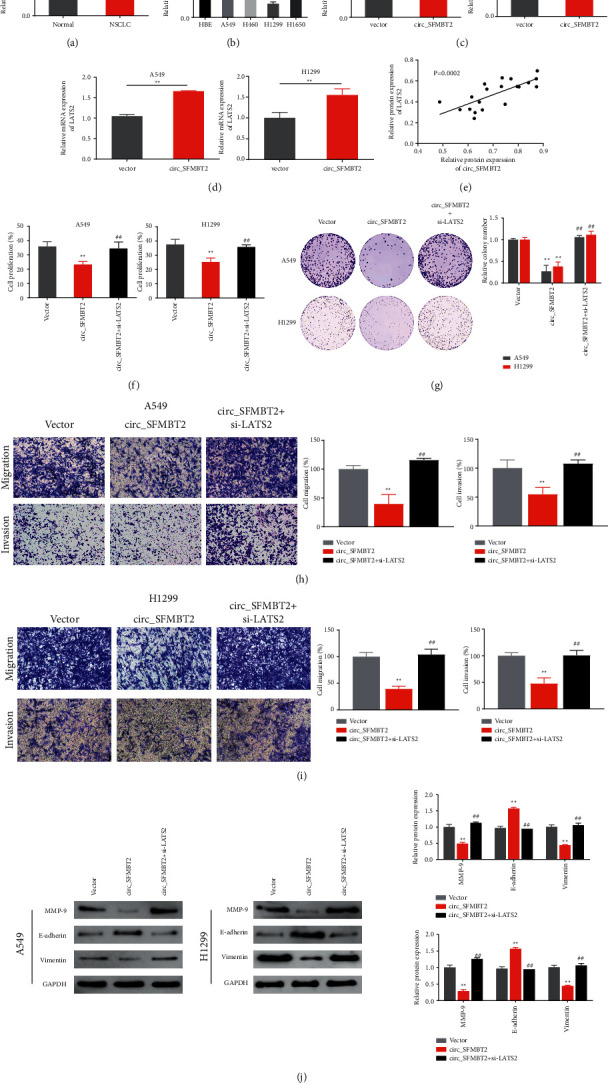
Figure 2.

Regulatory effects of circ_SFMBT2 and LATS2 on the NSCLC cell malignancies A and B. Analysis of the expression level of LATS2 in paired tumor and noncancerous tissues (a) or various NSCLC cells as well as HBE cells (b) via qRT-PCR. ∗∗p < 0.01 versus the normal group; ∗∗p < 0.05 versus the HBE group. Determination of circ_SFMBT2 (c) or the LATS2 (d) expression level in the cir_cSFMBT2-overexpressing cells via qRT-PCR. ∗∗p < 0.01 versus the vector group. (e) Pearson's correlation analysis identified a correlation between circ_SFMBT2 and LATS2 expression in the tissues. (f–i) The cell proliferative activity (f), colony-forming ability (g), and migratory ability (h, i) measured using CCK-8 assay, colony formation assay, and transwell assay, respectively. (j) Western blot analysis of MMP-9, E-cadherin, and vimentin expression in the cells. ∗∗p < 0.01 versus the vector group, and ##p < 0.01 versus the circ_SFMBT2 group.
