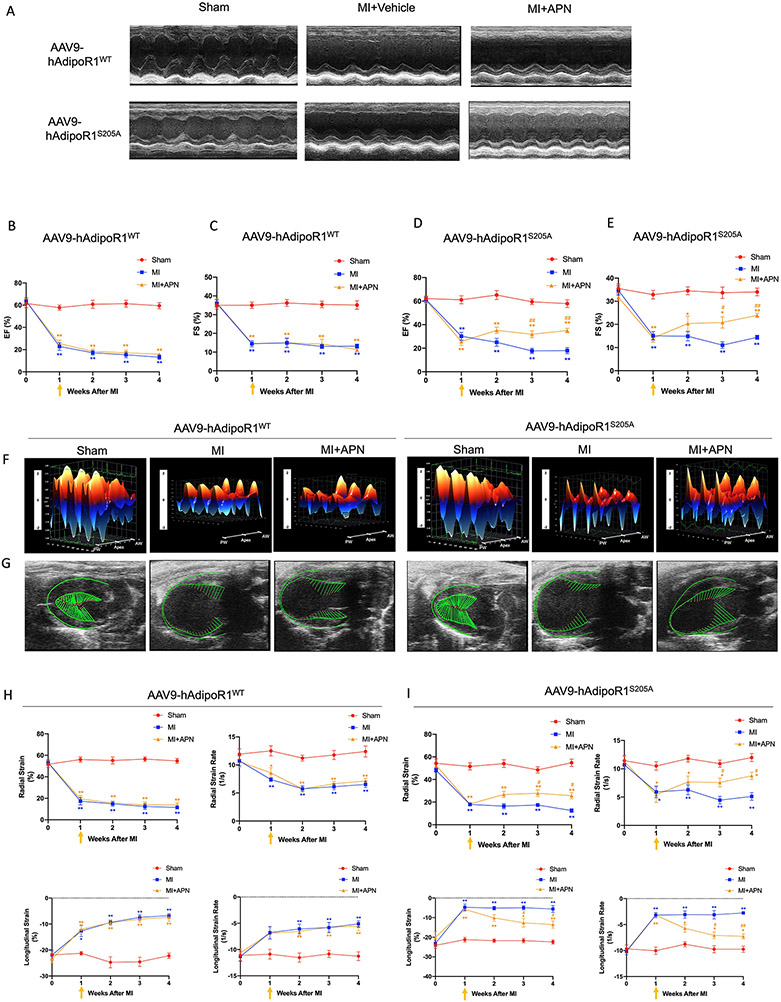
Figure 7.
AAV9-AdipoR1S205A restores APN’s protective effect on cardiac function following MI). A: Representative echocardiographic images (M-mode tracing) 4 weeks after MI. B-E: Quantitative analysis of cardiac function derived from echocardiography. F: 3D regional wall velocity diagrams (B-mode tracing) of left ventricular endomyocardial strain showing contraction (orange) and relaxation (blue) of 3 consecutive cardiac cycles. G: Vector diagrams showing direction and magnitude of endocardial contraction at midsystole using the parasternal long-axis. H/I: Quantitative analysis of strain and strain rate measured across the left ventricular endocardium. For B/C and H, n=6 mice for Sham, n=7 mice for MI, n=8 mice for MI+APN group. For D/E and I, n=5 mice for Sham, n=9 mice for MI, n=8 mice for MI+APN group. For B-E and H/I, statistical significance was evaluated by a two-way ANOVA with a repeated measures ANOVA (based on GLM). Post hoc all pairwise comparisons were performed after Tukey correction. AW indicates anterior wall; PW, posterior wall. **(yellow)p<0.01, *(yellow)p<0.05 MI+APN vs. Sham; **(blue)p<0.01, *(blue)p<0.05 MI vs. Sham, ##(yellow)p<0.01, #(yellow)p<0.05 MI+APN vs. MI.

