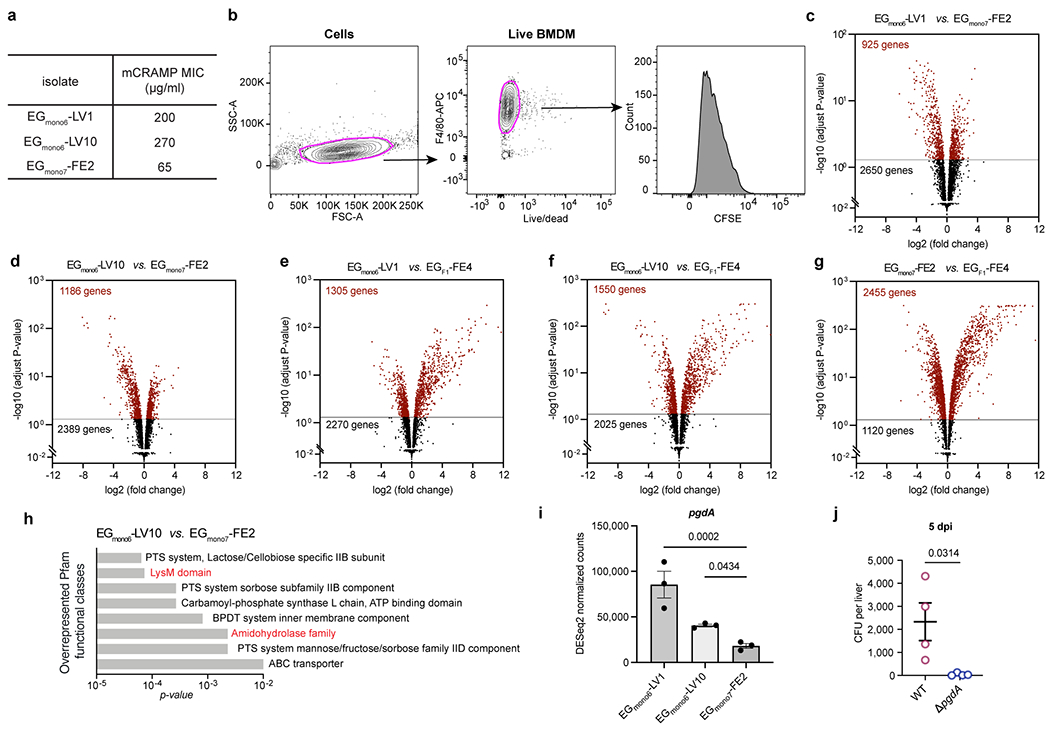
Extended Data Fig. 5 |. Transcriptomic comparisons of liver and faecal E. gallinarum isolates, and susceptibility of E. gallinarum pgdA mutant to liver clearance.

a, The minimum inhibitory concentrations (MIC) of mCRAMP against E. gallinarum isolates. b, Gating strategy used to select live macrophages and quantify CFSE signal in Fig. 3c. c-g, Volcano plots showing adjusted p-value versus fold change for 3575 genes expressed in EGmono6-LV1 (c), EGmono6-LV10 (d) as compared to EGmono7-FE2, or in EGmono6-LV1 (e), EGmono6-LV10 (f) and EGmono7-FE2 (g) isolate as compared to the ancestral strain EGF1-FE4. Horizontal lines show the p-value cut-off for significance after correction for multiple testing (adjust p-value < 0.05). Differentially expressed genes are coloured as red. n = 3 independent cultures. h, Overrepresented Pfam functional classes (EGmono6-LV10 vs. EGmono7-FE2). i, Expressions of pgdA gene in cultured E. gallinarum isolates. n = 3 independent cultures. j, Liver clearance of intravenously injected wild-type or pgdA mutant strains of E. gallinarum. Liver bacterial load 5 days post-injection. n = 4 mice. Representative of two independent experiments. Data in (i, j) represent mean ± SEM. Two-tailed Wald test with Benjamini-Hochberg correction (FDR = 0.05) (c-g), one-way ANOVA with Benjamini-Hochberg correction (FDR = 0.05) (i), unpaired two-tailed t-test (j).
