
Fig 5 |. Within-host evolution across additional microbial contexts and bacterial species.
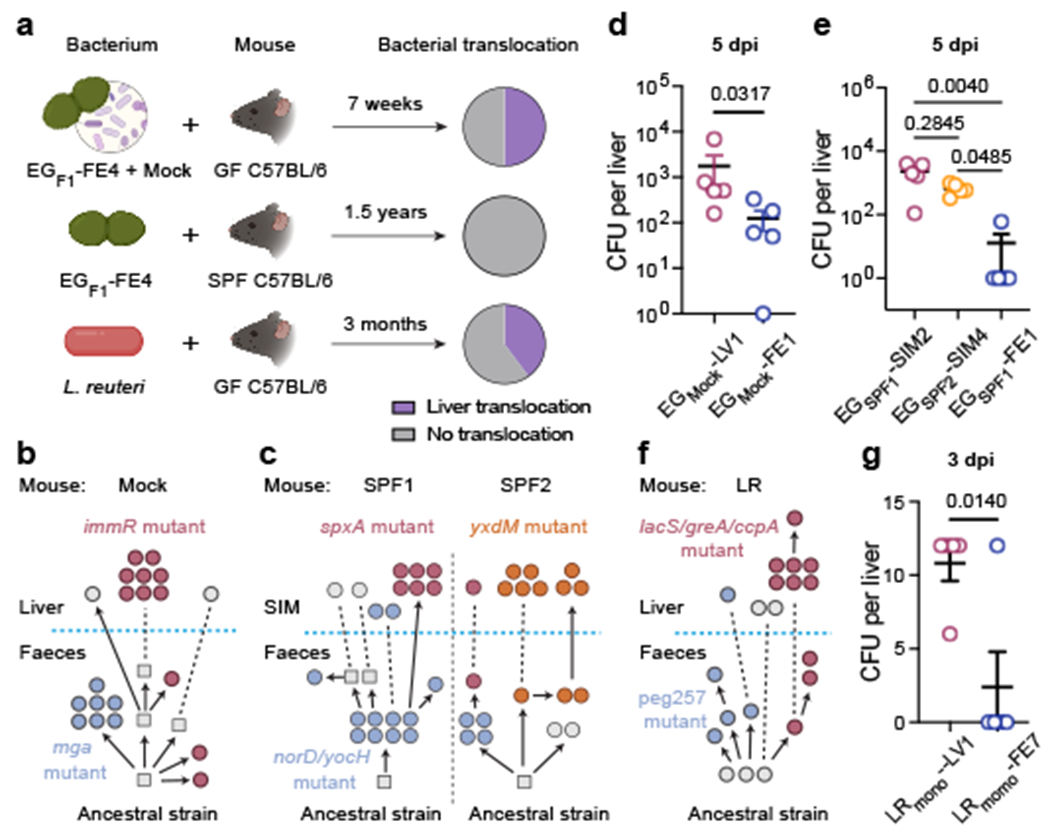
a, Schematic of experimental evolution of E. gallinarum in a mock (top, n = 6 mice) and SPF (centre, n = 3 mice) community or L. reuteri in monocolonisation (bottom, n = 5 mice). Pie charts showing proportions of mice with liver translocation. b, c, Reconstructed phylogenetic histories of E. gallinarum isolates sampled from an MC mouse (b) or two co-housed SPF mice (c). d, e, Liver clearance of intravenously injected E. gallinarum. Representative liver (EGmock-LV1) and faecal (EGmock-FE1) isolates from an MC mouse (d). Representative SIM (EGSPF1-SIM2, EGSPF2-SIM4) and faecal (EGSPF1-FE1) isolates from SPF mice (e). Liver bacterial load 5 dpi. n = 5 mice. f, Reconstructed phylogenetic history of L. reuteri isolates. g, Liver clearance of intravenously injected liver (LRmono-LV1) and faecal (LRmono-FE7) L. reuteri isolates. Liver bacterial load 3 dpi. n = 5 mice. Schematics in (b, c, f) are organized as described in Fig 2a. Genotypes of bacterial isolates examined in (d, e, g) are described in Supplementary Table 7. Results are representative of two (d, e, g) independent experiments. Data in (d, e, g) represent mean ± SEM. Two-tailed Mann-Whitney test (d), Kruskal-Wallis test with Benjamini-Hochberg correction (FDR = 0.05) (e), unpaired two-tailed t-test (g). SIM, small intestinal mucosa. dpi, days post-injection.