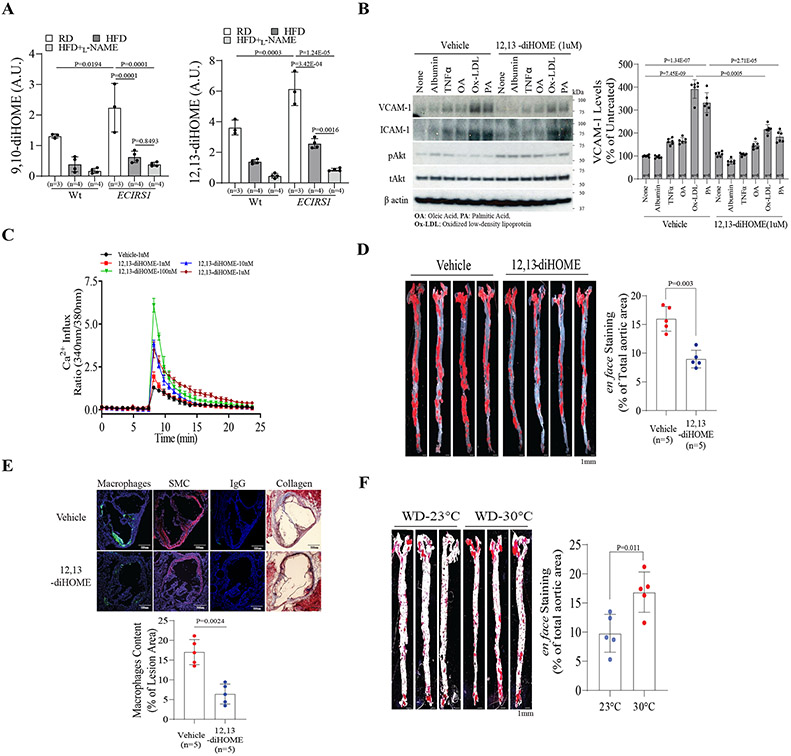
Figure 6. Levels of plasma lipokines in Wt and ECIRS1 mice and effects of exogenous 12,13-diHOME on EC and severity of atherosclerosis.
(A) Plasma 9,10-diHOME (Left) 12,13-diHOME (Right) levels from lipidomic analysis data of the plasma from Wt and ECIRS1 mice on RD or HFD with or without L-NAME. (B) Representative immunoblot analysis (Left) and quantification (Right) of VCAM-1 and ICAM-1 protein levels in BAEC after treatment with TNFα, OA, Ox-LDL or PA with or without 12,13-diHOME (100uM). (C) Measurement of Ca2+ influx by Fluor-4 in BAEC after being treated with different doses of 12,13-diHOME (1nM-1uM). (D) en face stained aorta and quantification of aortas from HFD-ApoE−/− mice treated with 12,13-diHOME (scale bar, 1mm). (E) Representative images and quantification for collagen and macrophages stained in cryo-sections of the aortic sinus (scale bar, 500um). (F) en face stained aorta and quantification of aortas from WD-ApoE−/− mice exposure at 23°C or 30°C (scale bar, 1mm). Biological replicates n=5 for each group. P values were determined by Mann-Whitney U test in C, D, E, and F. Biological replicates n=5-6 for each group. P values were determined by Kruskal-Wallis with Dunn’s multiple comparison test in A and B. Data presented as mean ± SD; n=mice/group as indicated.

