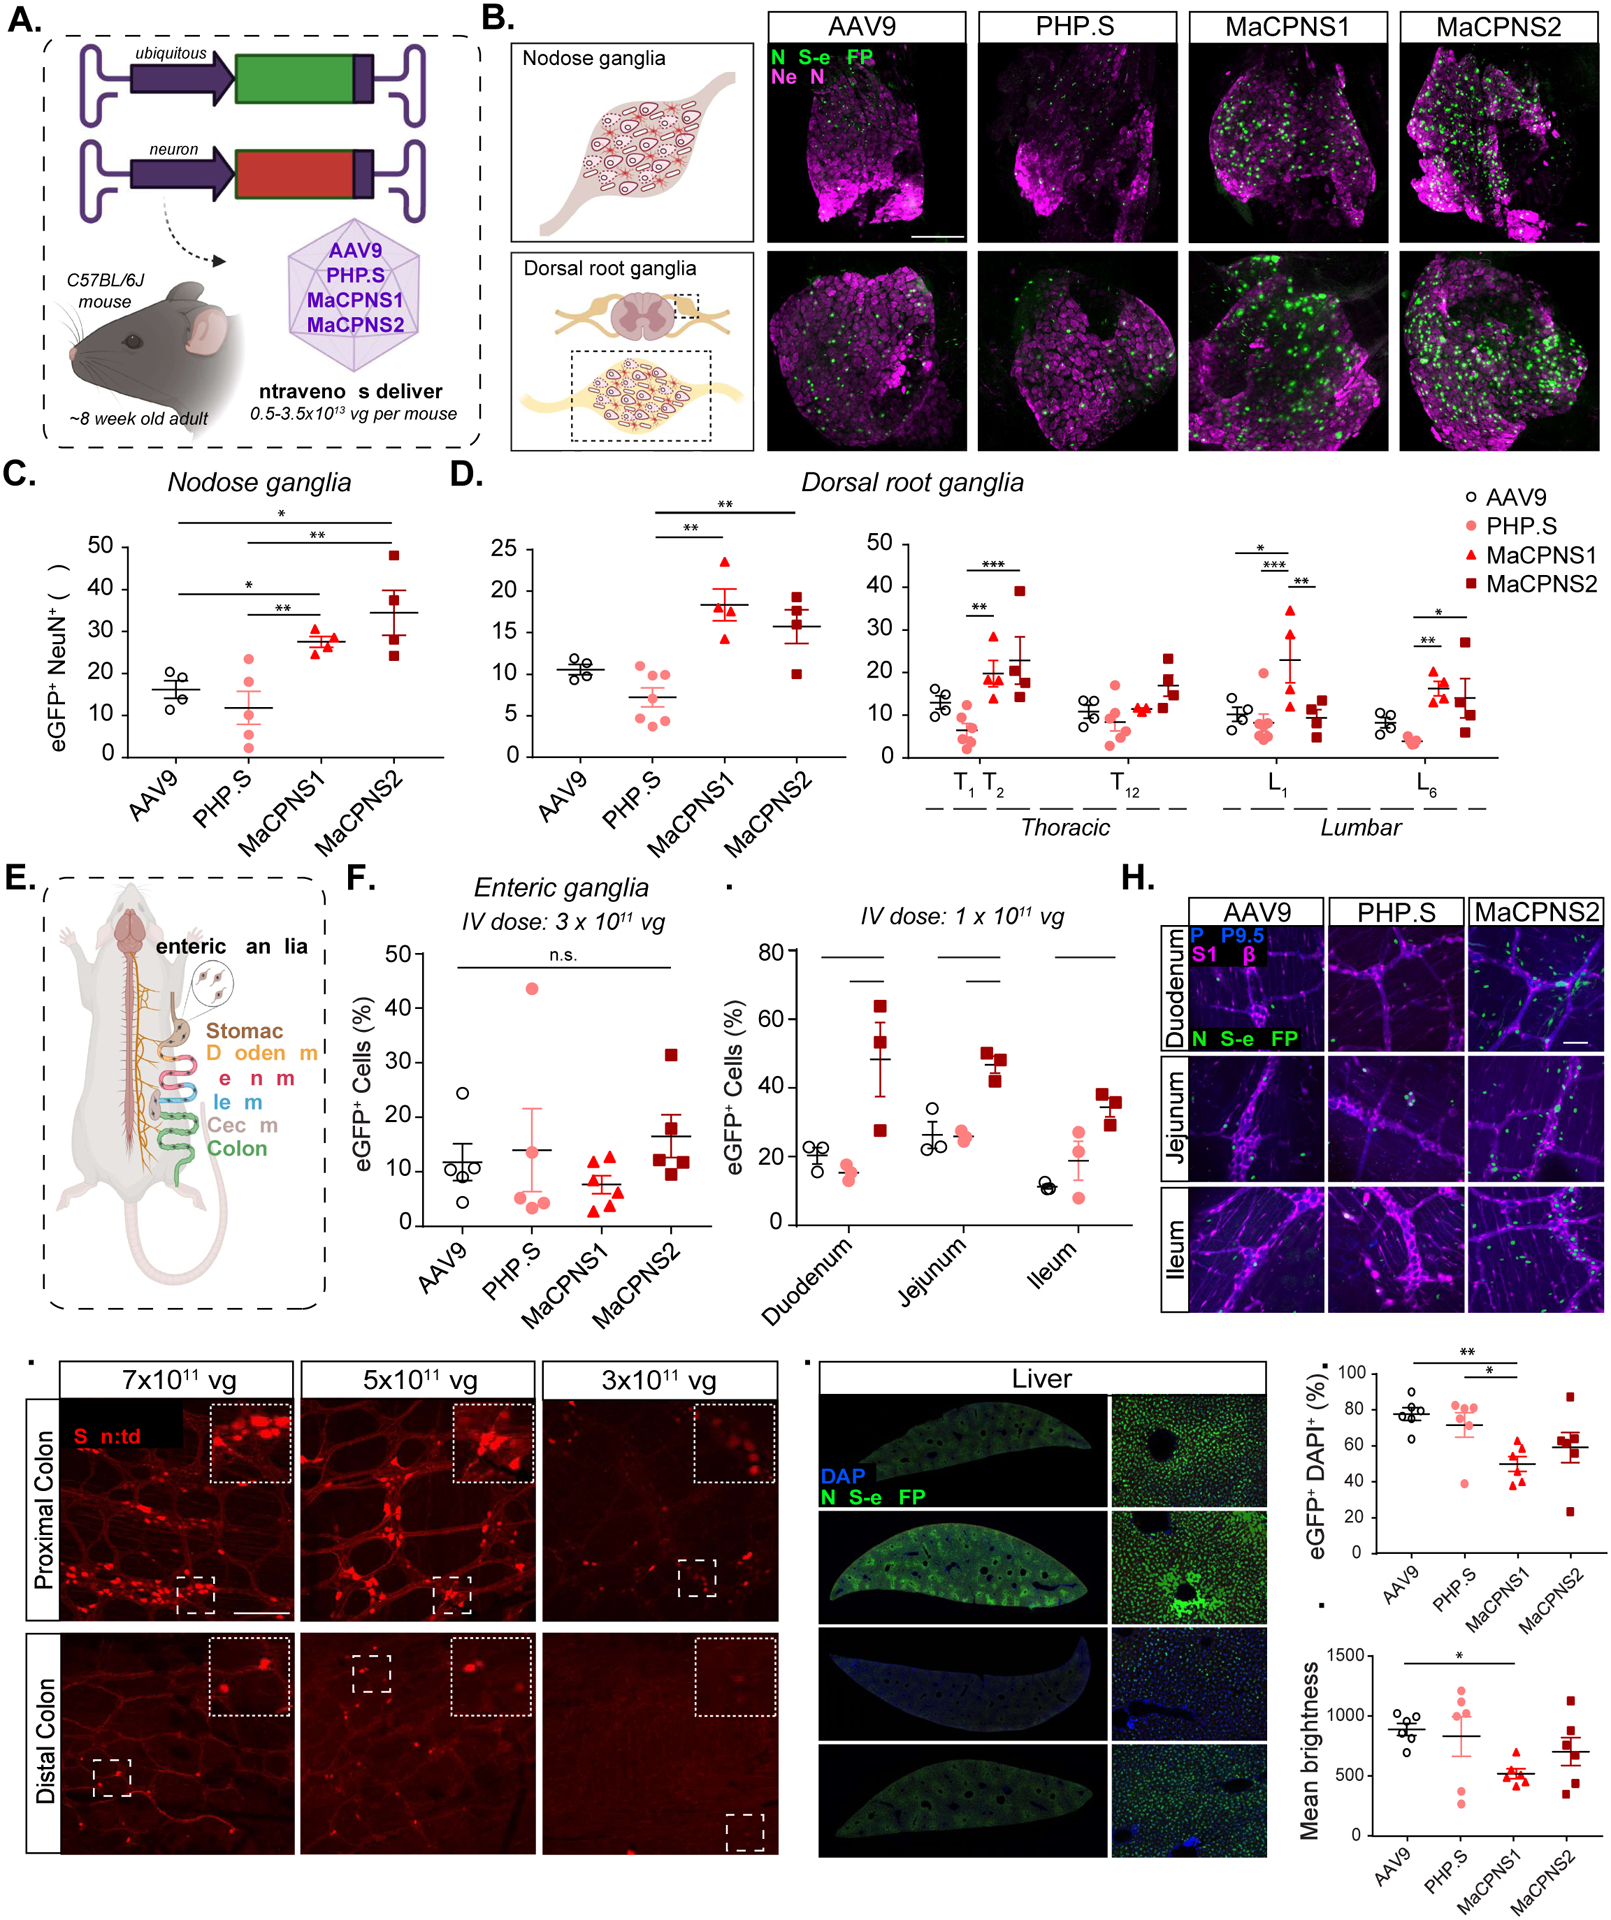
Figure 2: Engineered AAVs can efficiently target the peripheral nervous system in mice following systemic delivery.

A. Illustration demonstrating the IV administration of AAV capsids packaged with ssAAV:CAG-2xNLS-eGFP and ssAAV:hSyn-tdTomato genome in a mouse model (~8 week-old young C57BL/6J adults). B. (Top) An illustration of the nodose ganglia (NG) (left), and representative images of AAV9, PHP.S, MaCPNS1 and MaCPNS2 vector-mediated expression of nuclear-localized (NLS) eGFP (green) in NG (right). (Bottom) An illustration of the dorsal root ganglia (DRG) in the spinal cord (left) and (right) representative images of AAV vector-mediated expression of NLS-eGFP (green) in DRG across segment T2 (Thoracic) of the spinal cord (n≥4 per group, ~8 week-old C57BL/6J males, 3×10¹¹ vg IV dose per mouse, 3 weeks of expression). Magenta: αNeuN antibody staining for neurons. Images are matched in fluorescence intensity to the respective AAV9 control. Scale bar: 200 μm. C. Percentage of AAV-mediated eGFP expression overlapping with the αNeuN marker in NG. One-way ANOVA non-parametric Kruskal-Wallis test (exact P=0.0003), and follow-up multiple comparisons with uncorrected Dunn’s test are reported (P=0.0499 for AAV9 versus MaCPNS1, P=0.0251 for AAV9 versus MaCPNS2, P=0.0094 for PHP.S versus MaCPNS1, P=0.0038 for PHP.S versus MaCPNS2). *P ≤ 0.05, **P ≤ 0.01 are shown, P > 0.05 is not shown; n≥4 per group, same experimental parameters as B. Each data point represents 1–2 nodose ganglia per mouse comprising >700 cells, mean ± s.e.m is plotted. D. Percentage of eGFP expression overlapping with the αNeuN marker in DRG (left) where each data point shows the mean per mouse across select DRGs within thoracic and lumbar segments of the spinal cord. A one-way ANOVA, non-parametric Kruskal-Wallis test (exact P=0.0005), and follow-up multiple comparisons with uncorrected Dunn’s test are reported (P=0.0018 for PHP.S versus MaCPNS1, P=0.0087 for PHP.S versus MaCPNS2). *P ≤ 0.05, **P ≤ 0.01 are shown, P > 0.05 is not shown; n≥4 per group, same experimental parameters as B. Each data point shows mean ± s.e.m of DRGs across different areas of each mouse, comprising a mean of 1–2 DRGs per area with >200 αNeuN+ cells per DRG. (Right) Percentage of eGFP expression overlapping with the αNeuN marker in DRG across spinal cord areas in individual mice. A two-way ANOVA and Tukey’s multiple comparisons tests with adjusted P values are reported (*P ≤ 0.05, **P ≤ 0.01 and ***P ≤ 0.001 are shown, P > 0.05 is not shown). Each data point shows the mean ± s.e.m of 1–2 DRG per mouse comprising >200 αNeuN+ cells per DRG. E. Illustration of the adult mouse gastrointestinal (GI) tract, highlighting the enteric ganglia (zoom-in) that are spread across the different segments of the GI tract. F. Percentage of cells expressing NLS-eGFP delivered by AAV vectors in the myenteric plexus across the GI tract: stomach, duodenum, jejunum, ileum, proximal colon and cecum (ssAAV:CAG-2xNLS-eGFP genome, n≥5 per group, ~8 weeks old C57BL/6J males, 3×10¹¹ vg IV dose per mouse, 3 weeks of expression). A one-way ANOVA non-parametric Kruskal-Wallis test (approximate P=0.2985), and follow-up multiple comparisons using uncorrected Dunn’s test are reported (individual P > 0.05, n.s.). Each data point shows the mean ± s.e.m of >100 enteric ganglia per intestinal segment per mouse). G. Percentage of cells expressing NLS-eGFP (green in H) in the myenteric plexus of small intestinal segments: duodenum, jejunum and ileum delivered by AAV vectors: AAV9, PHP.S and MaCPNS2 (ssAAV:CAG-2xNLS-eGFP genome, n=3 per group, 1×10¹¹ vg IV dose per mouse, 3 weeks of expression). Two-way ANOVA, Tukey’s multiple comparisons tests with adjusted P values are reported (*P ≤ 0.05, **P ≤ 0.01 and ***P ≤ 0.001 are shown, P > 0.05 is not shown). Each data point shows the mean ± s.e.m of ≥ 2 images per mouse comprising >100 enteric ganglia. H. shows representative images of AAV-mediated eGFP expression across the individual intestinal segments analyzed in G. Scale bar: 50 μm. The tissues were co-stained with αS100β (magenta) antibody for glia and αPGP9.5 (blue) for neurons. The images are matched in fluorescence intensity to the respective AAV9 control. I. MaCPNS2 vector-mediated expression of tdTomato (red) from ssAAV:hSyn-tdTomato in the proximal and distal segments of the colon at three different IV doses per mouse: 7×10¹¹ vg, 5×10¹¹ vg, 3×10¹¹ vg (3 weeks of expression, n=3 per group, scale bar: 200 μm, dotted white box inset represents a zoomed-in view of the indicated area in each image). Images in the distal and proximal colon are matched in fluorescence intensity. J. Representative images of AAV vector-mediated expression of NLS-eGFP (green) from ssAAV:CAG-2xNLS-eGFP in the liver (n=6 per group, 3×10¹¹ vg IV dose/mouse, 3 weeks of expression, blue: DAPI staining of nuclei, scale bar: 1 mm (left, full cross-sectional image), and 50 μm (right, higher magnification view). The images are matched in fluorescence intensity to the respective AAV9 control. K. Percentage of eGFP+ cells overlapping with the DAPI marker in the liver. A non-parametric Kruskal-Wallis test (approximate P=0.0168), and follow-up multiple comparisons with uncorrected Dunn’s test (P=0.0035 for AAV9 versus MaCPNS1 and P=0.0189 for PHP.S versus MaCPNS1) are reported (*P ≤ 0.05, **P ≤ 0.01 are shown, P > 0.05 is not shown; same experimental parameters as J., each data point shows the mean ± s.e.m of 4 images per mouse comprising >780 DAPI+ cells per image). L. Mean brightness of the eGFP+ cells quantified in K. A non-parametric Kruskal-Wallis test (approximate P=0.1698), and follow-up multiple comparisons with uncorrected Dunn’s test (P=0.0433 for AAV9 versus MaCPNS1) is reported (*P ≤ 0.05 is shown, P > 0.05 is not shown; each data point shows the mean ± s.e.m of 4 images per mouse comprising >780 DAPI+ cells per image).
