


Figure 4: Engineered AAVs can efficiently target the peripheral nervous system in adult rats following systemic administration.
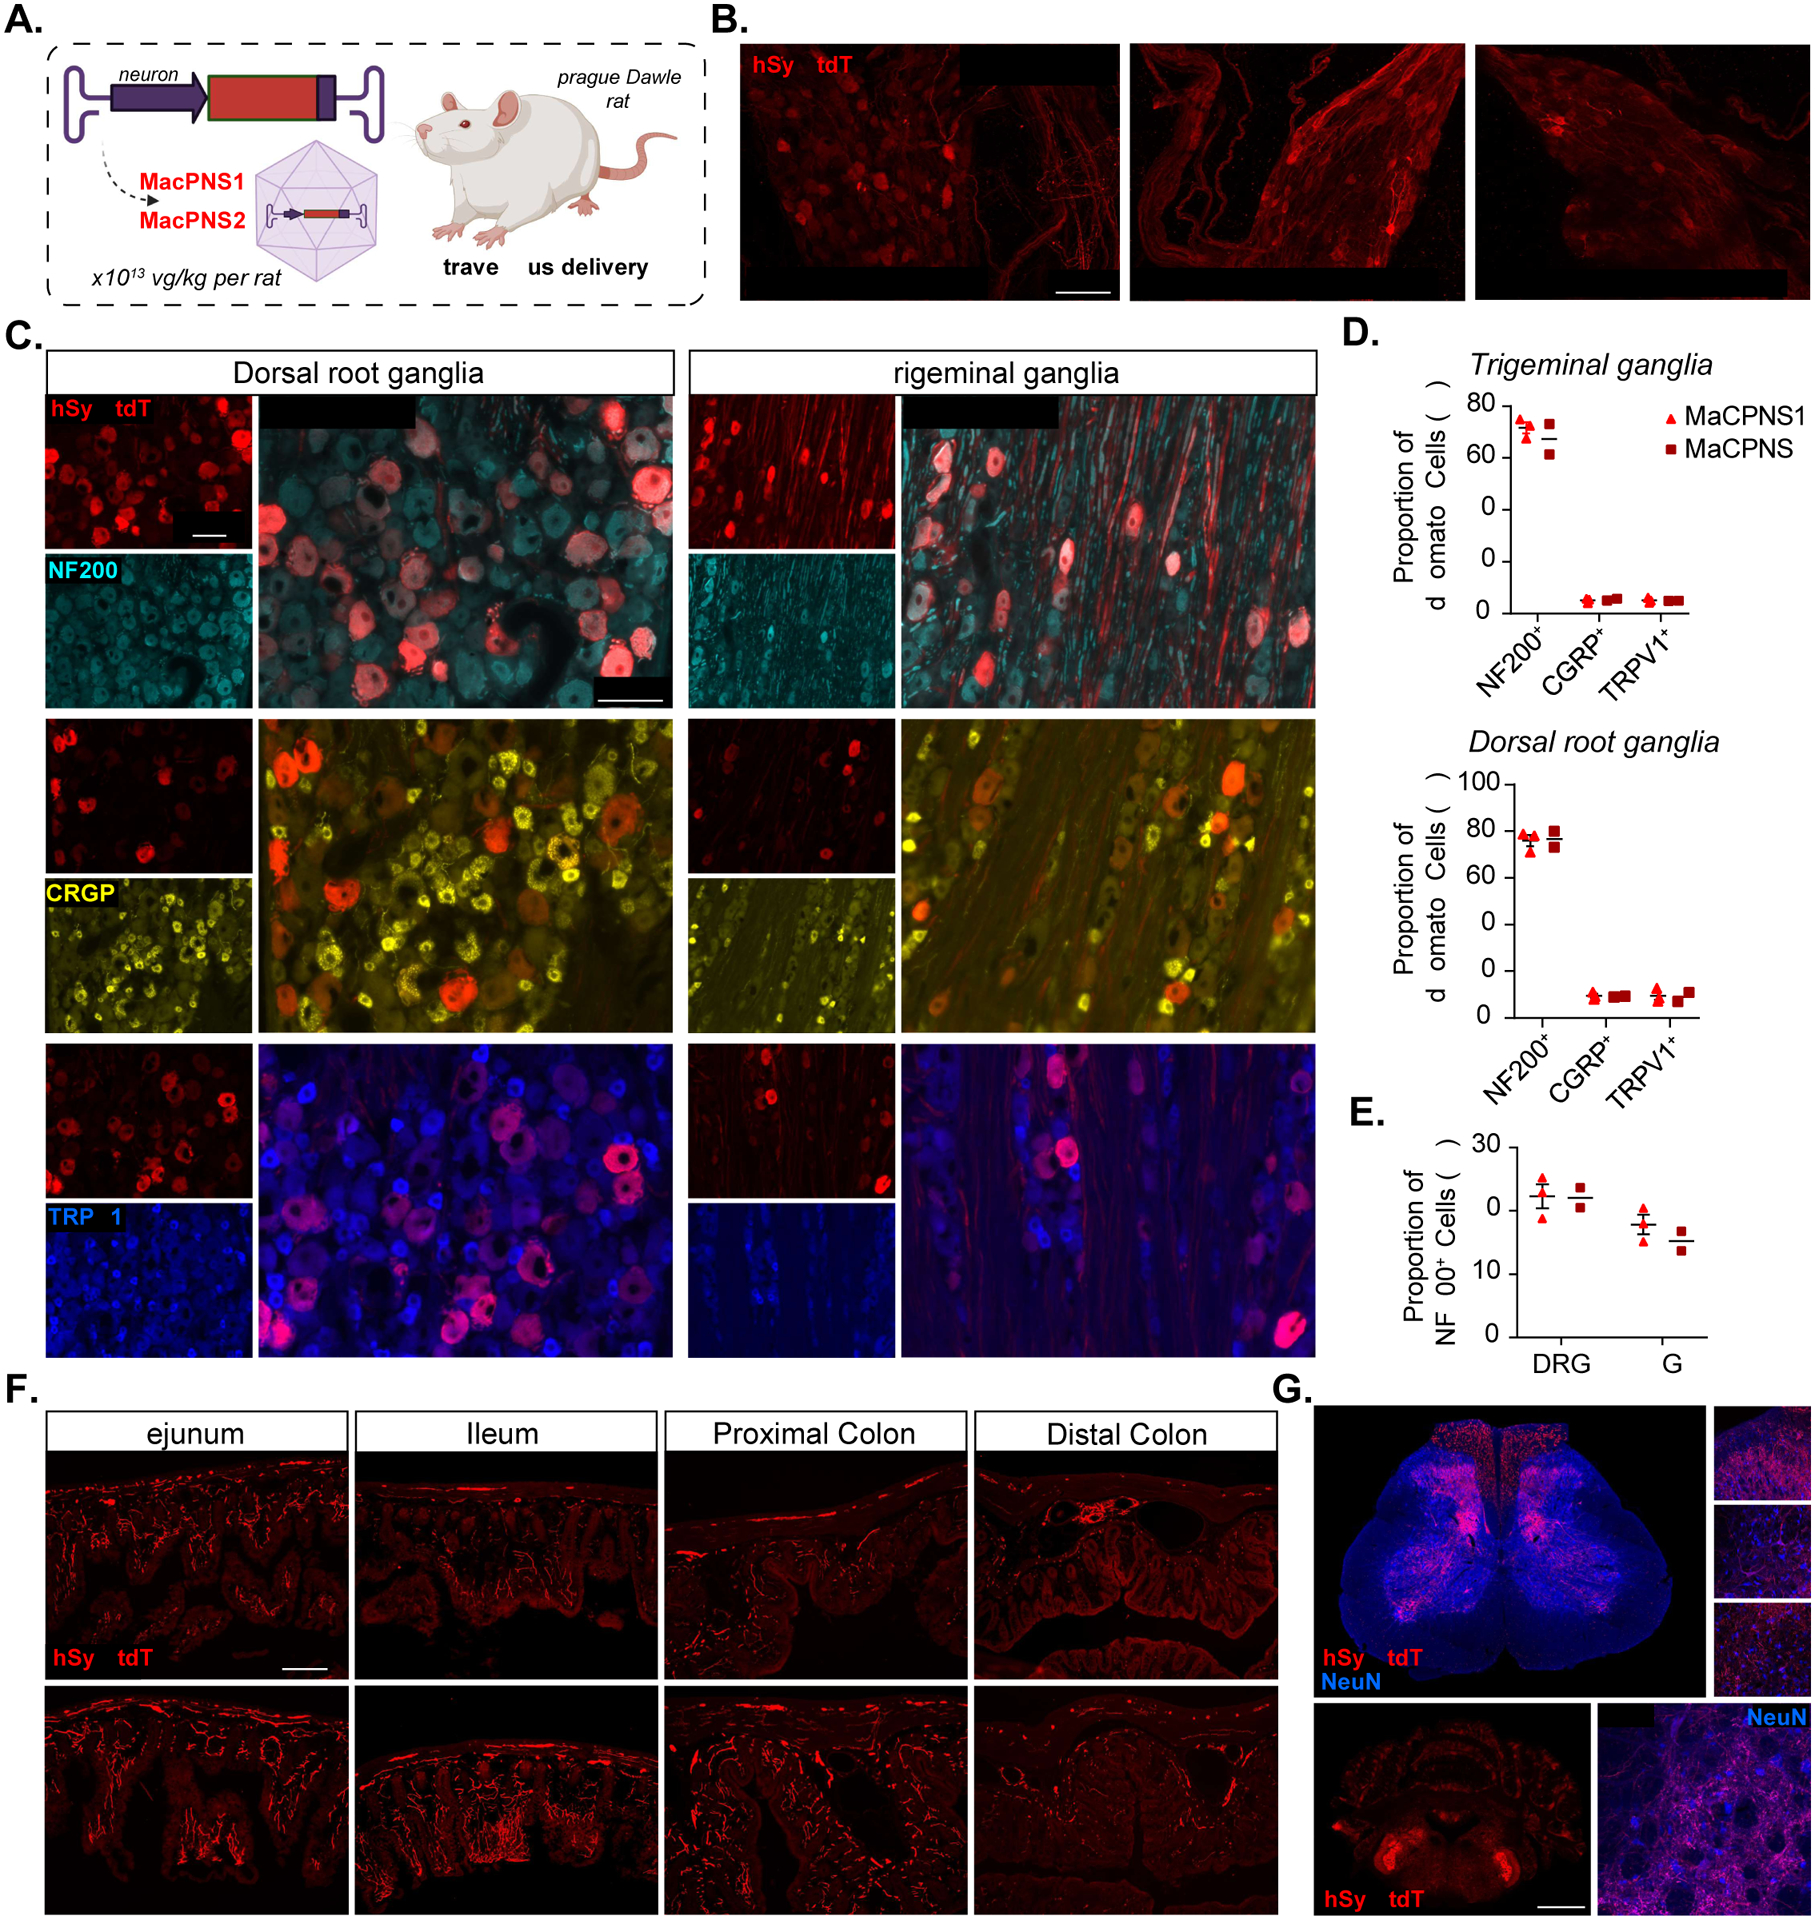
A. Illustration of IV administration of AAV capsids MaCPNS1 and MaCPNS2 packaged with ssAAV:hSyn-tdTomato genome in a rat model (young adults, Sprague Dawley, male, 2×10¹³ vg/kg per rat). The rat tissues were stained with αDsRed (red) antibody against tdTomato B. Representative images of MaCPNS1 vector-mediated tdTomato (red) expression in major pelvic ganglia (left), sympathetic chain ganglia (middle) and inferior mesenteric ganglia (right) in adult rats 3 weeks post expression (n≥2 per group, scale bar: 100 μm). C. Representative images of MaCPNS1 vector-mediated tdTomato (red) expression in DRG (left) and TG (right). The tissues were co-stained with either αNF200 (cyan), αCGRP (yellow), or αTRPV1 (blue) markers (scale bars: 100 μm). D. Quantification of proportion of AAV-mediated tdTomato expressing cells that overlap with αNF200, αCGRP and αTRPV1 markers in TG (above) and DRG (below), and E. proportion of αNF200 marker+ cells that overlap with the AAV-mediated tdTomato expressing cells in DRG and TG (n≥2 per group, each data point represents the average of at least 3 images from each rat, mean ± s.e.m is plotted for n>2, mean is plotted for n=2). F. Representative images of MaCPNS1 and MaCPNS2 vector-mediated tdTomato expression across different segments of the GI tract: jejunum, ileum, proximal colon and distal colon (scale bar: 200 μm). G. Representative images of MaCPNS1 vector-mediated tdTomato expression in the spinal cord (above, scale bar: 500 μm) with zoomed-in views of selected areas (white boxes, right, scale bar: 100 μm), and hindbrain (below, scale bar: 2 mm) with zoomed-in view of Sp5O region (scale bar: 100 μm). The tissues were co-stained with αNeuN (blue) antibodies.