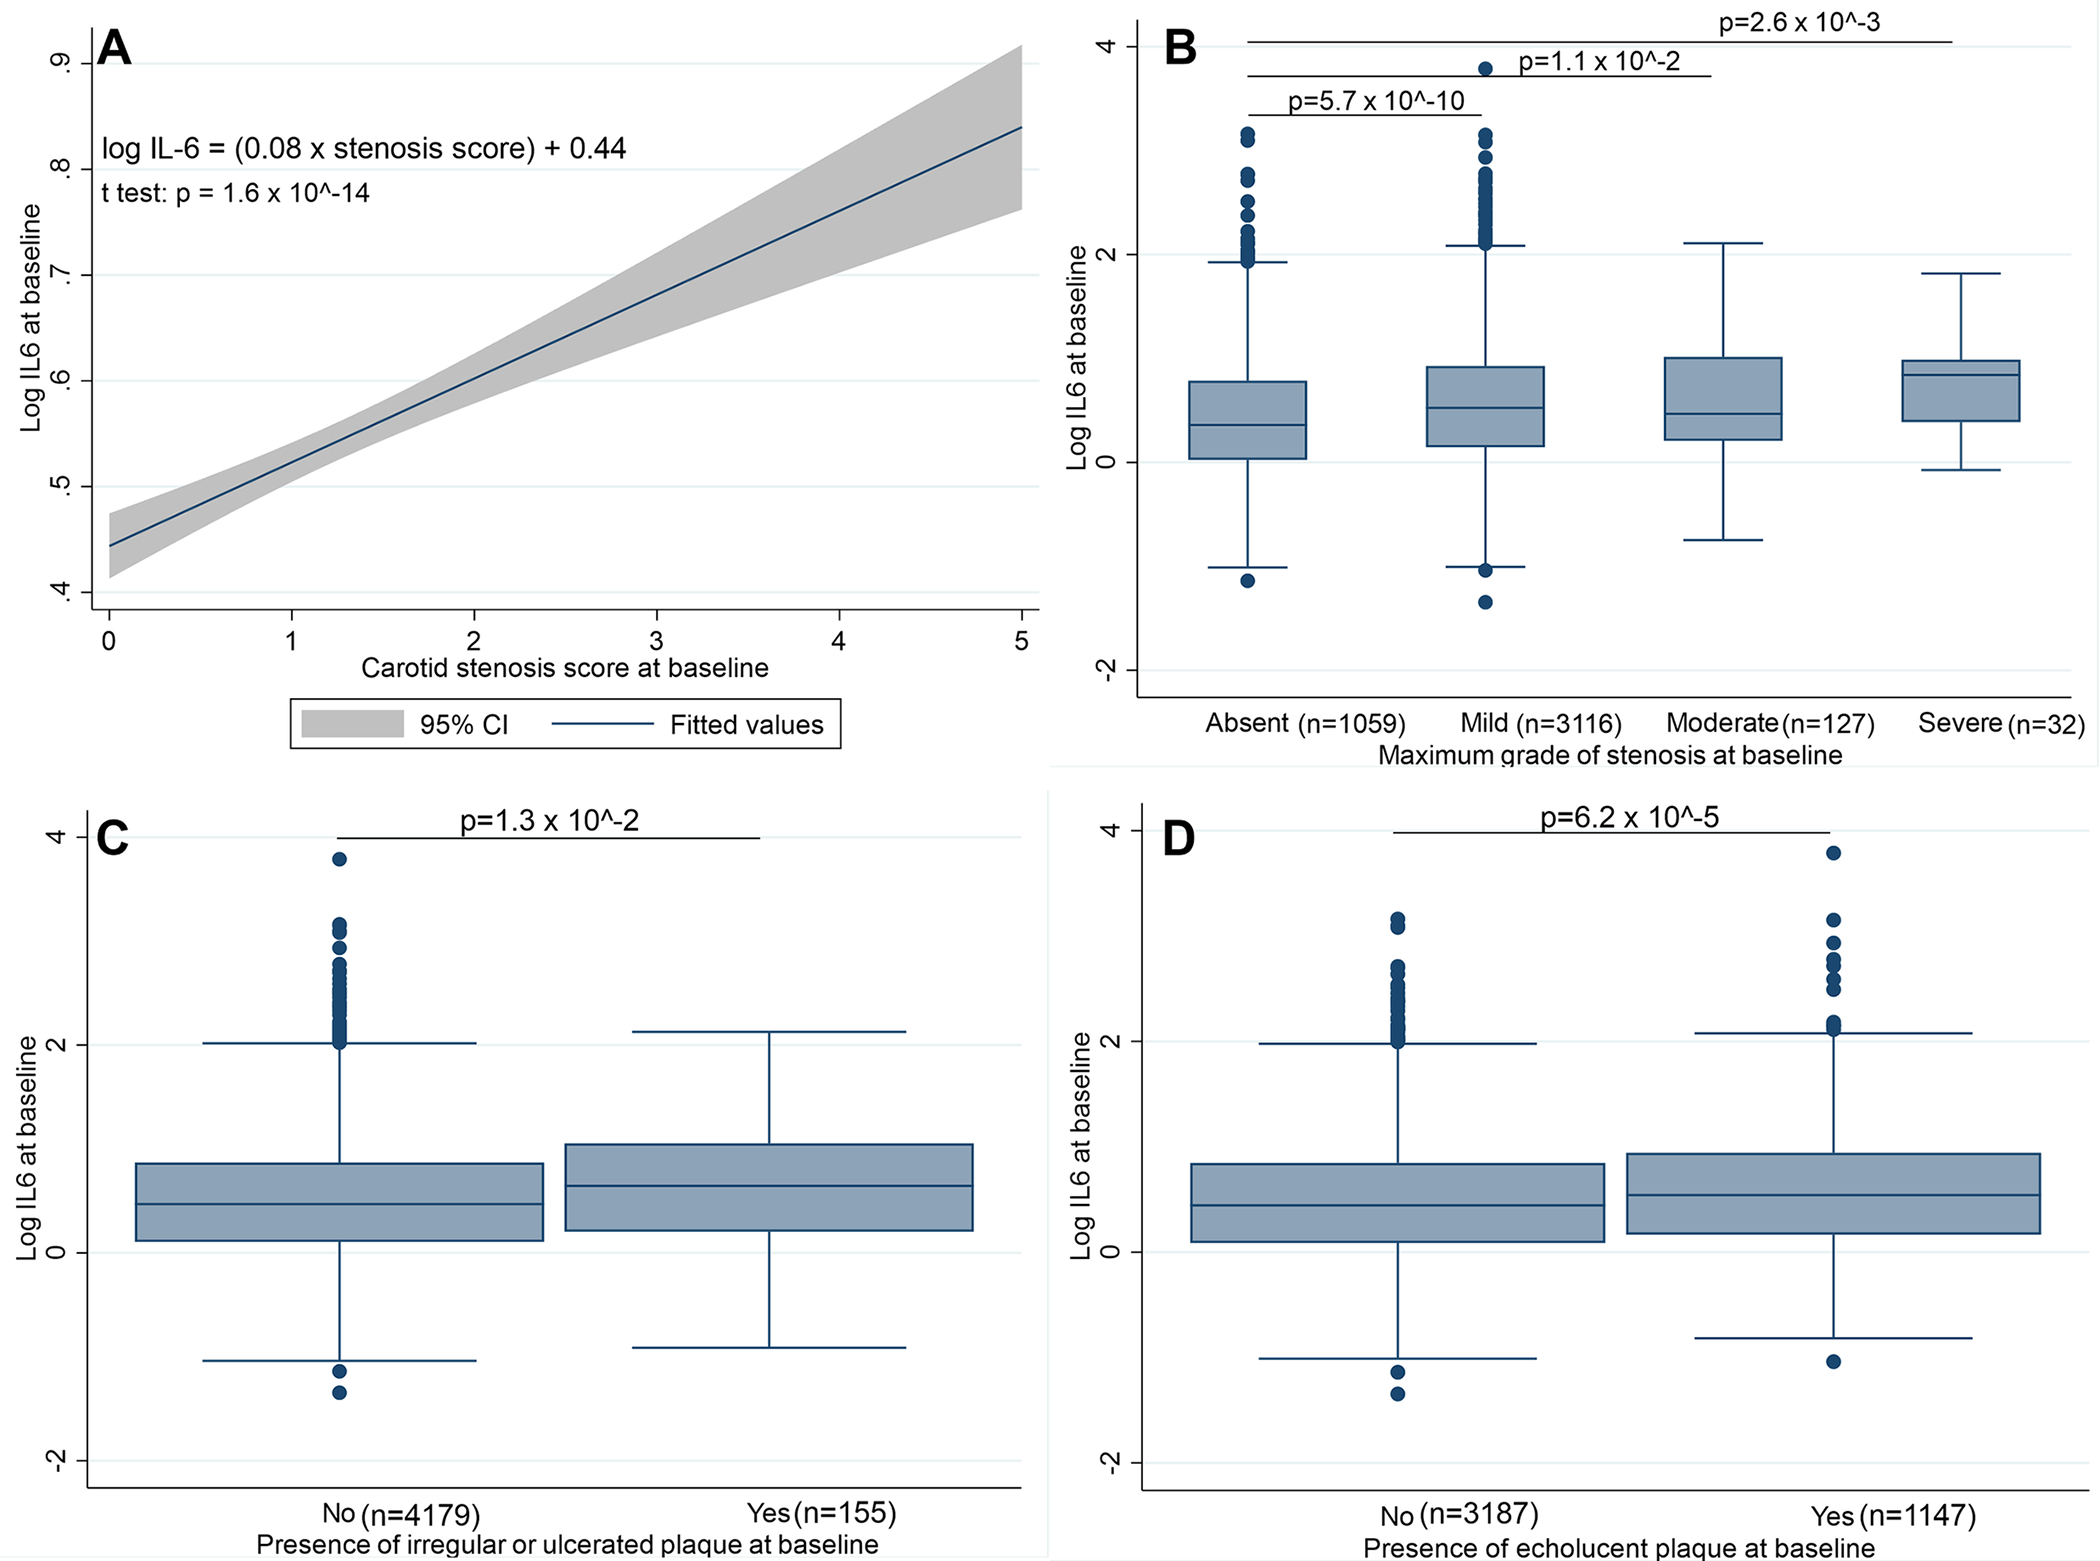
Figure 2: Relationship of IL-6 with the grade of carotid stenosis.

A: Univariable linear regression of log IL-6 over the baseline carotid stenosis score (β = 0.08, p-value of the t test for significance of the coefficient p=1.6 × 10⁻¹⁴).
B: Distribution of log IL-6 across categories of stenosis severity. All p-values are derived from unadjusted two-sample Student t tests.
C: Comparison of mean log IL-6 in patients with versus without markedly irregular or ulcerated carotid plaques. The p-value is derived from an unadjusted two-sample Student t test.
D: Comparison of mean log IL-6 in patients with versus without echolucent carotid plaques. The p-value is derived from an unadjusted two-sample Student t test.
Panels B-D are also presented as violin plots in Supplementary Figure S7.
