
Extended Data Fig.6 |. Conductivity of HvMLO to divalent and monovalent cations.
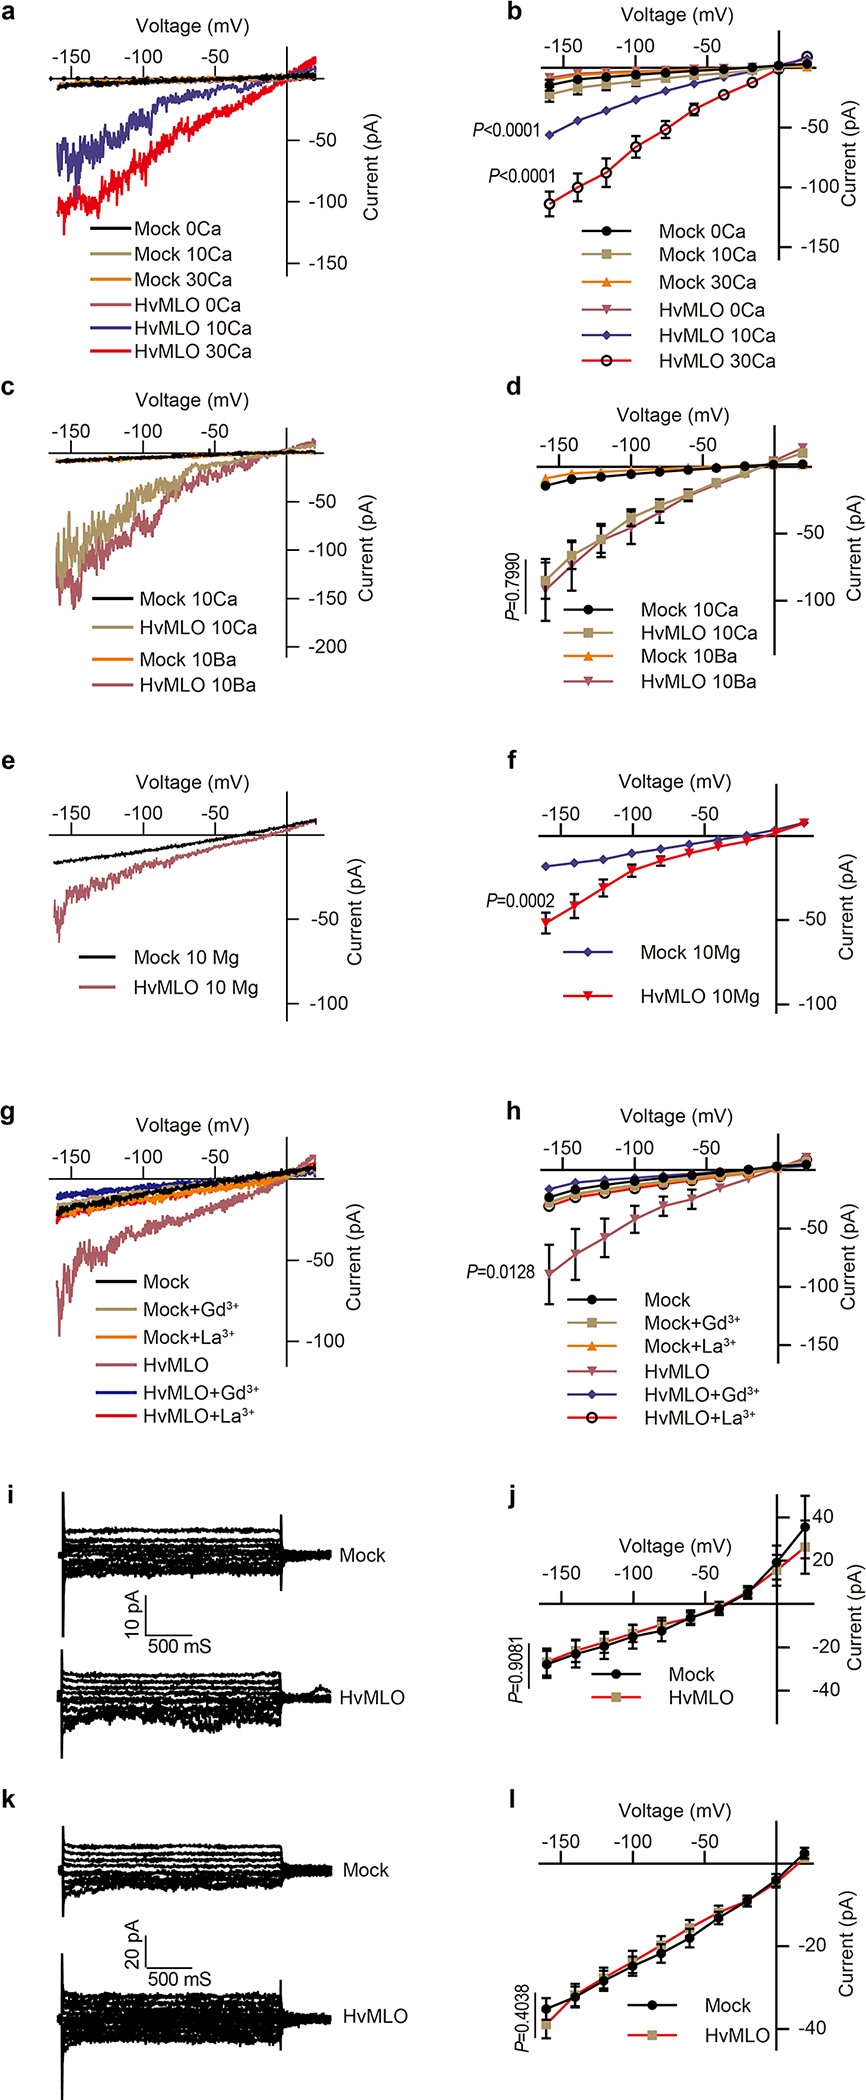
(a) Typical whole-cell recordings and (b) average current-voltage curves of the inward currents showing external Ca2+ dependence (0 mM, 10 mM and 30mM) in HEK293T cells expressing HvMLO. (c) Typical whole-cell recordings and (d) average current-voltage curves for Ba2+ conductance by HvMLO in HEK293T cells. (e) Typical whole-cell recordings and (f) average current-voltage curves for Mg2+ conductance by HvMLO in HEK293T cells. (g) Typical whole-cell recordings and (h) average current-voltage curves for Gd3+ (100 μM) and La3+ (100 μM) inhibition of Ca2+ conductance in HEK293T cells expressing HvMLO. (i) Typical whole-cell recordings and (j) average current-voltage curves of the inward currents showing no detectable K+ conductance by HvMLO in HEK293T cells. (k) Typical whole-cell recordings and (l) average current-voltage curves of the inward currents showing no detectable Na+ conductance by HvMLO in HEK293T cells. Error bars depict means ± S.E.M. n values=8 cells. All P values were determined by two-tailed Student’s t-test.