
Fig. 2 |. MLO family proteins, including NTA, are Ca2+ permeable channels.
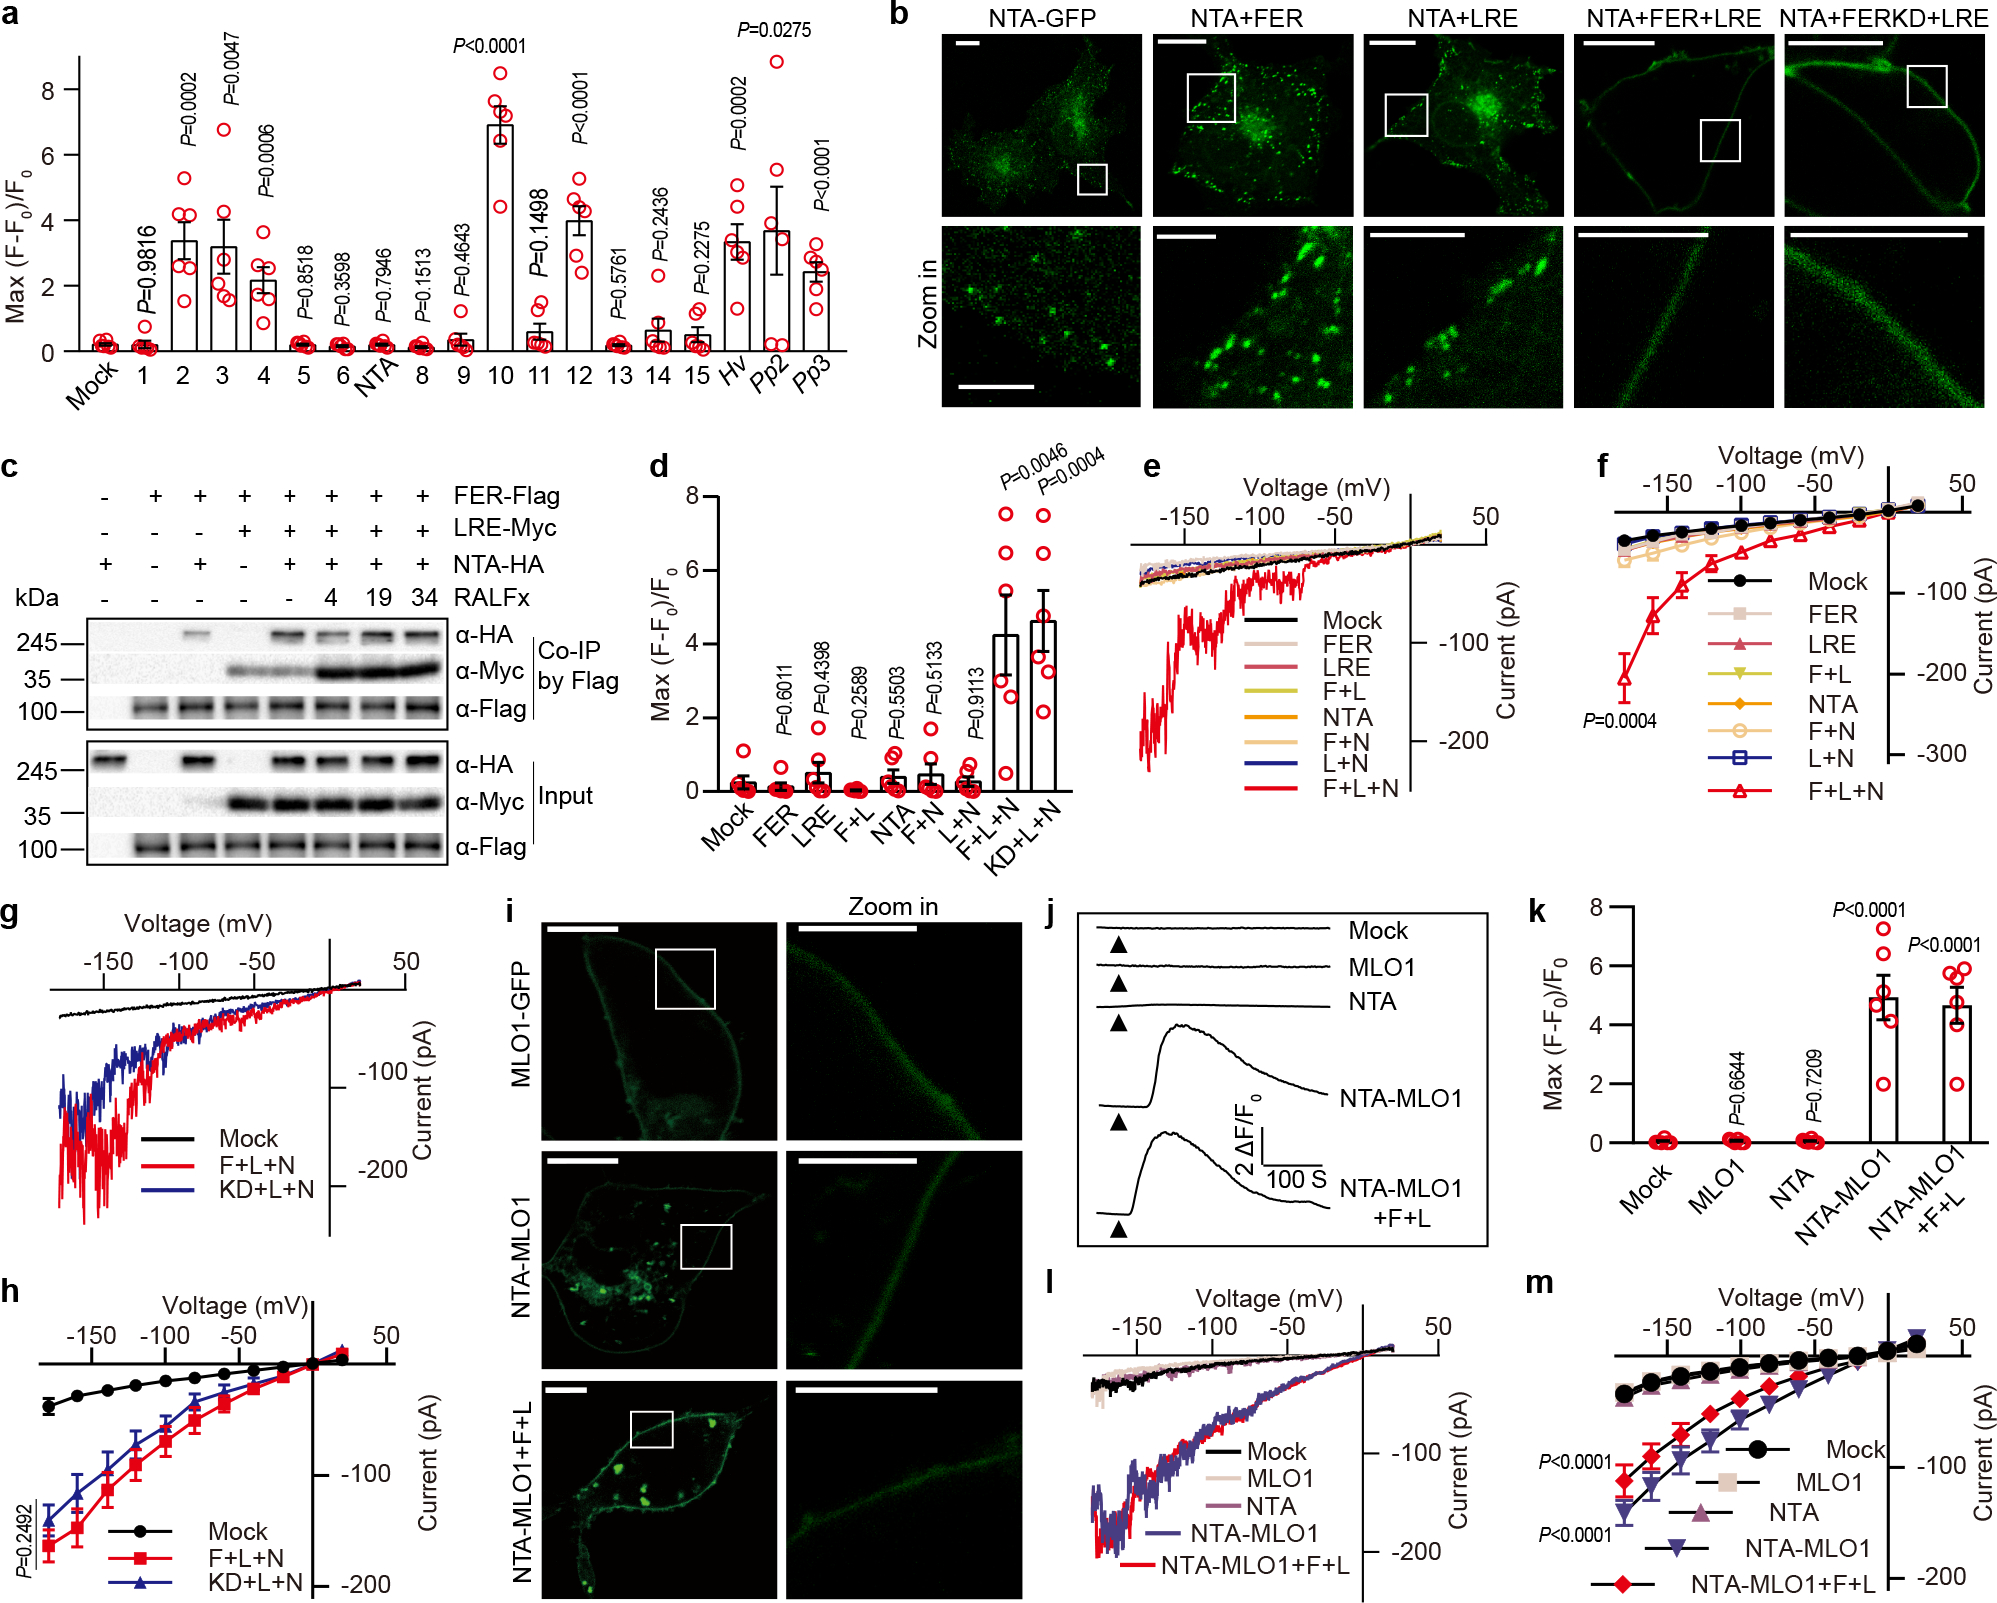
a, [Ca2+]cyt elevation measured by single cell fluorescence imaging in HEK293T cells expressing various MLOs. Hv denoted HvMLO, Pp2 denote PpMLO2, and Pp3 denote PpMLO3. b, FER and LRE facilitated the PM localization of NTA-GFP. Scale bars, 10 μm (up-panel), 5 μm (down-panel). The white rectangle indicated the area magnified in the lower panel. n=3 independent repeats. c, Co-IP of HA-tagged NTA, Myc-tagged LRE and Flag-tagged FER expressed in Xenopus oocytes with or without the addition of RALFs (each 5 μM) as indicated. Anti-Flag M2 affinity bead was used to co-IP, and western blots were probed with antibodies against Myc (α-Myc), HA (α-HA) and Flag (α-Flag). n=3 independent repeats. d, [Ca2+]cyt elevation measured by single cell imaging of in HEK293T cells expressing NTA (N), FER (F), FERK565R (kinase dead version) (KD) and LRE (L). (e-f) Typical whole-cell recordings (e) and current-voltage curves (f) of inward currents in HEK293T cells expressing NTA, FER and LRE. Similar analyses were conducted for HEK293T cells expressing NTA, LRE and the kinase-dead version of FER (g-h). i, MLO1 C-terminal cytosolic tail facilitated the PM localization of NTA-GFP. NTA-MLO1 denoted the chimeric protein of NTA and MLO1 C terminal tail. Scale bars, 10 μm (left-panel), 5 μm (right-panel). n=3 independent repeats. (j-k) Representative cytosolic Ca2+ spiking curves (j) and statistical analysis of peak values (k) in COS7 cells expressing the NTA-MLO1 chimeric or original channels. (l-m) Typical whole-cell recordings (l) and current-voltage curves (m) of inward currents in HEK293T cells expressing the NTA-MLO1 chimeric or original channels. For Ca2+ imaging in HEK293T cells, n =6 replicates, and ~ 60 cells were imaged in each duplicate. For patch-clamp, n=8 cells. Error bars depict means ± S.E.M. All P values were determined by two-tailed Student’s t-test.