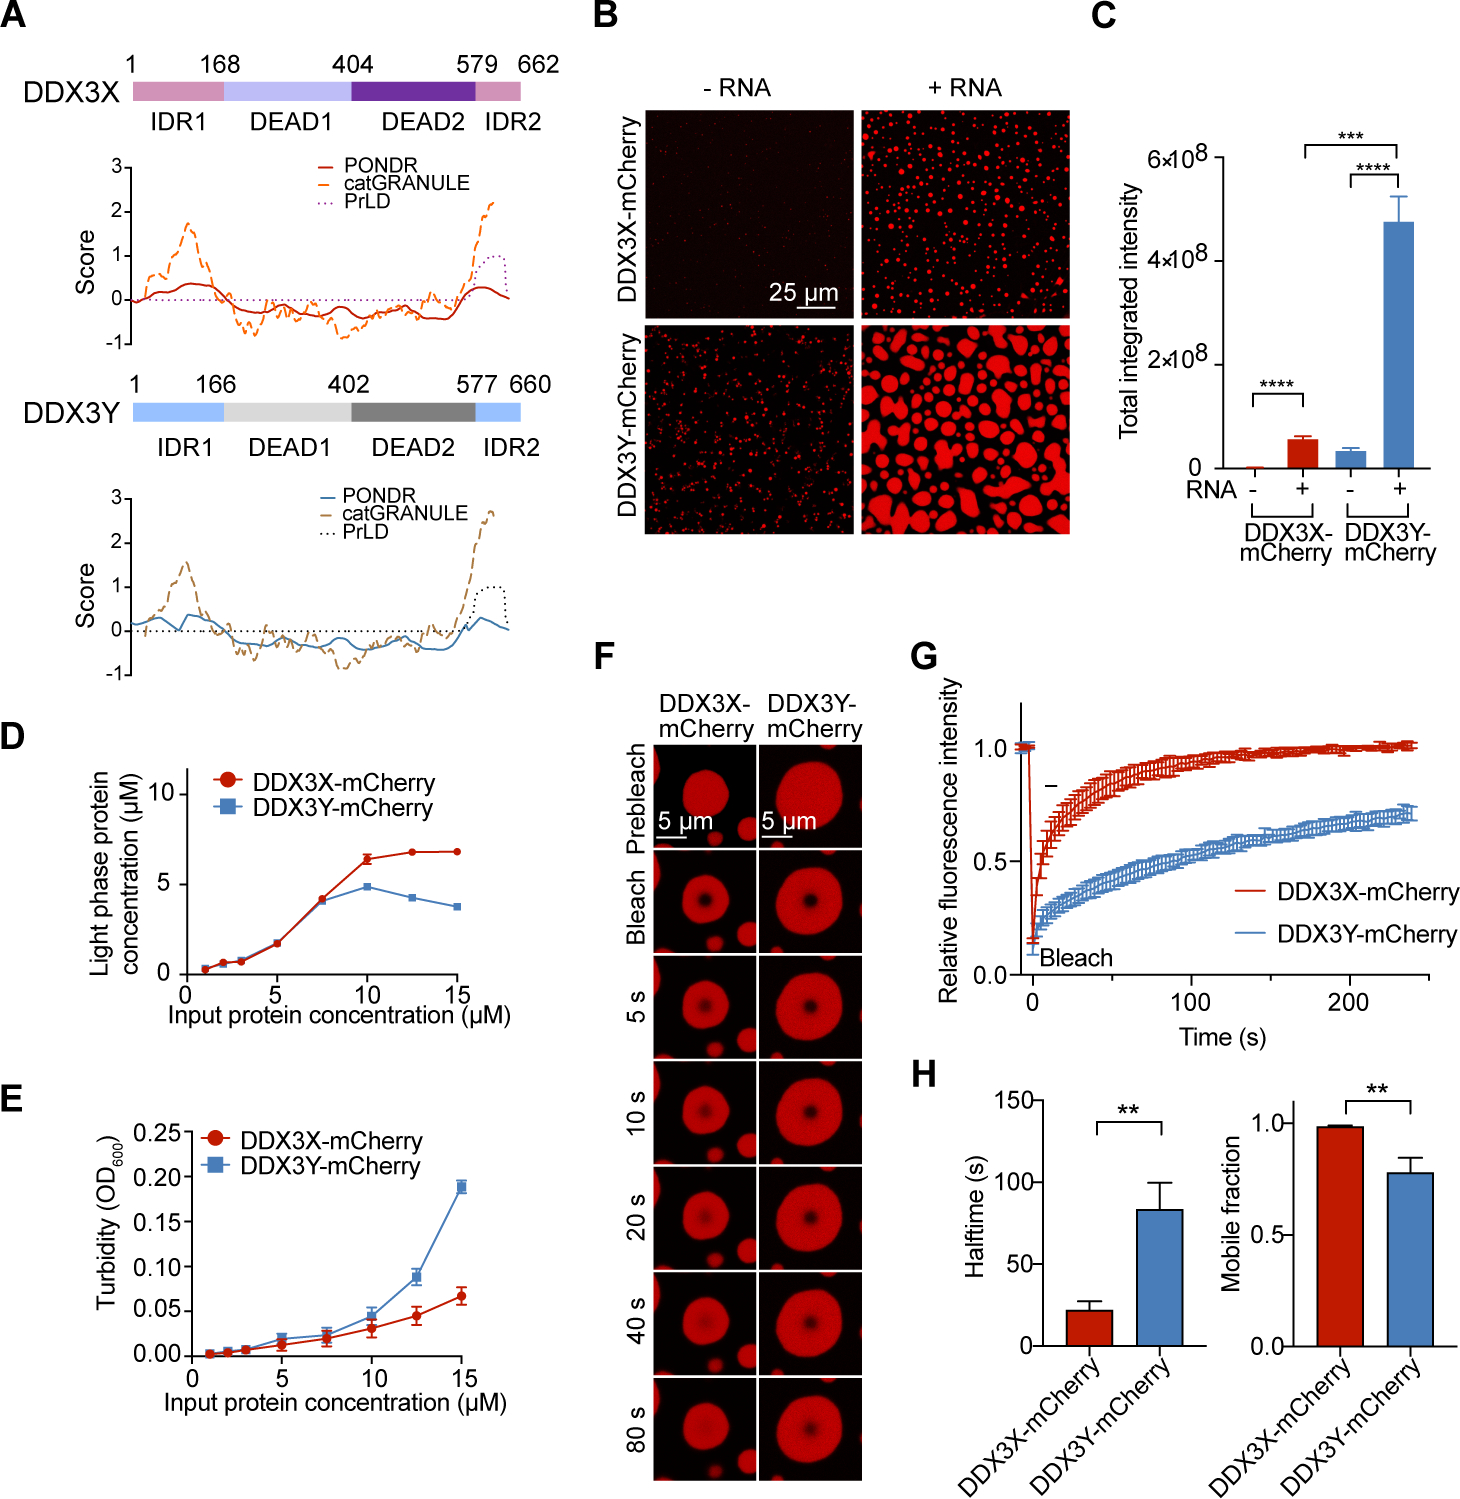
Figure 1. DDX3Y has a stronger LLPS propensity compared to DDX3X in vitro.

(A) Structural prediction of DDX3X and DDX3Y using PONDR (natural disordered regions), PLAAC (prion-like amino acid regions), and catGRANULE (LLPS propensity).
(B) In vitro droplet formation of 10 μM recombinant DDX3X-mCherry or DDX3Y-mCherry in the absence or presence of 200 ng/μL poly(U)-RNA. Scale bar, 25 μm.
(C) Quantification of the total integrated intensity of DDX3X condensation and DDX3Y condensation in Figure 1B. A two-tailed t-test was used to calculate the p-value. ***p < 0.001, **** p < 0.0001.
(D) Concentrations of DDX3 proteins in the light phase (supernatant after centrifugation) vs. input protein concentrations.
(E) Turbidity (absorbance at 600 nm) of DDX3X-mCherry and DDX3Y-mCherry LLPS. The mean value of turbidity and protein concentration for each condition from three separate protein purifications and three technical repeats were plotted in Figure 1D and 1E.
(F) Time-lapse images of in vitro FRAP experiments. The FRAP experiments were performed identically for DDX3X-mCherry and DDX3Y-mCherry droplets.
(G) FRAP curves for in vitro droplets of DDX3X-mCherry (red) and DDX3Y-mCherry (blue). The traces of the FRAP data represent mean ± s.e.m (n = 3, from three independent experiments).
(H) Halftime and mobile fractions from Figure 1G. A two-tailed t-test was used to calculate the p-value. **p < 0.01.
See also Figure S1.
