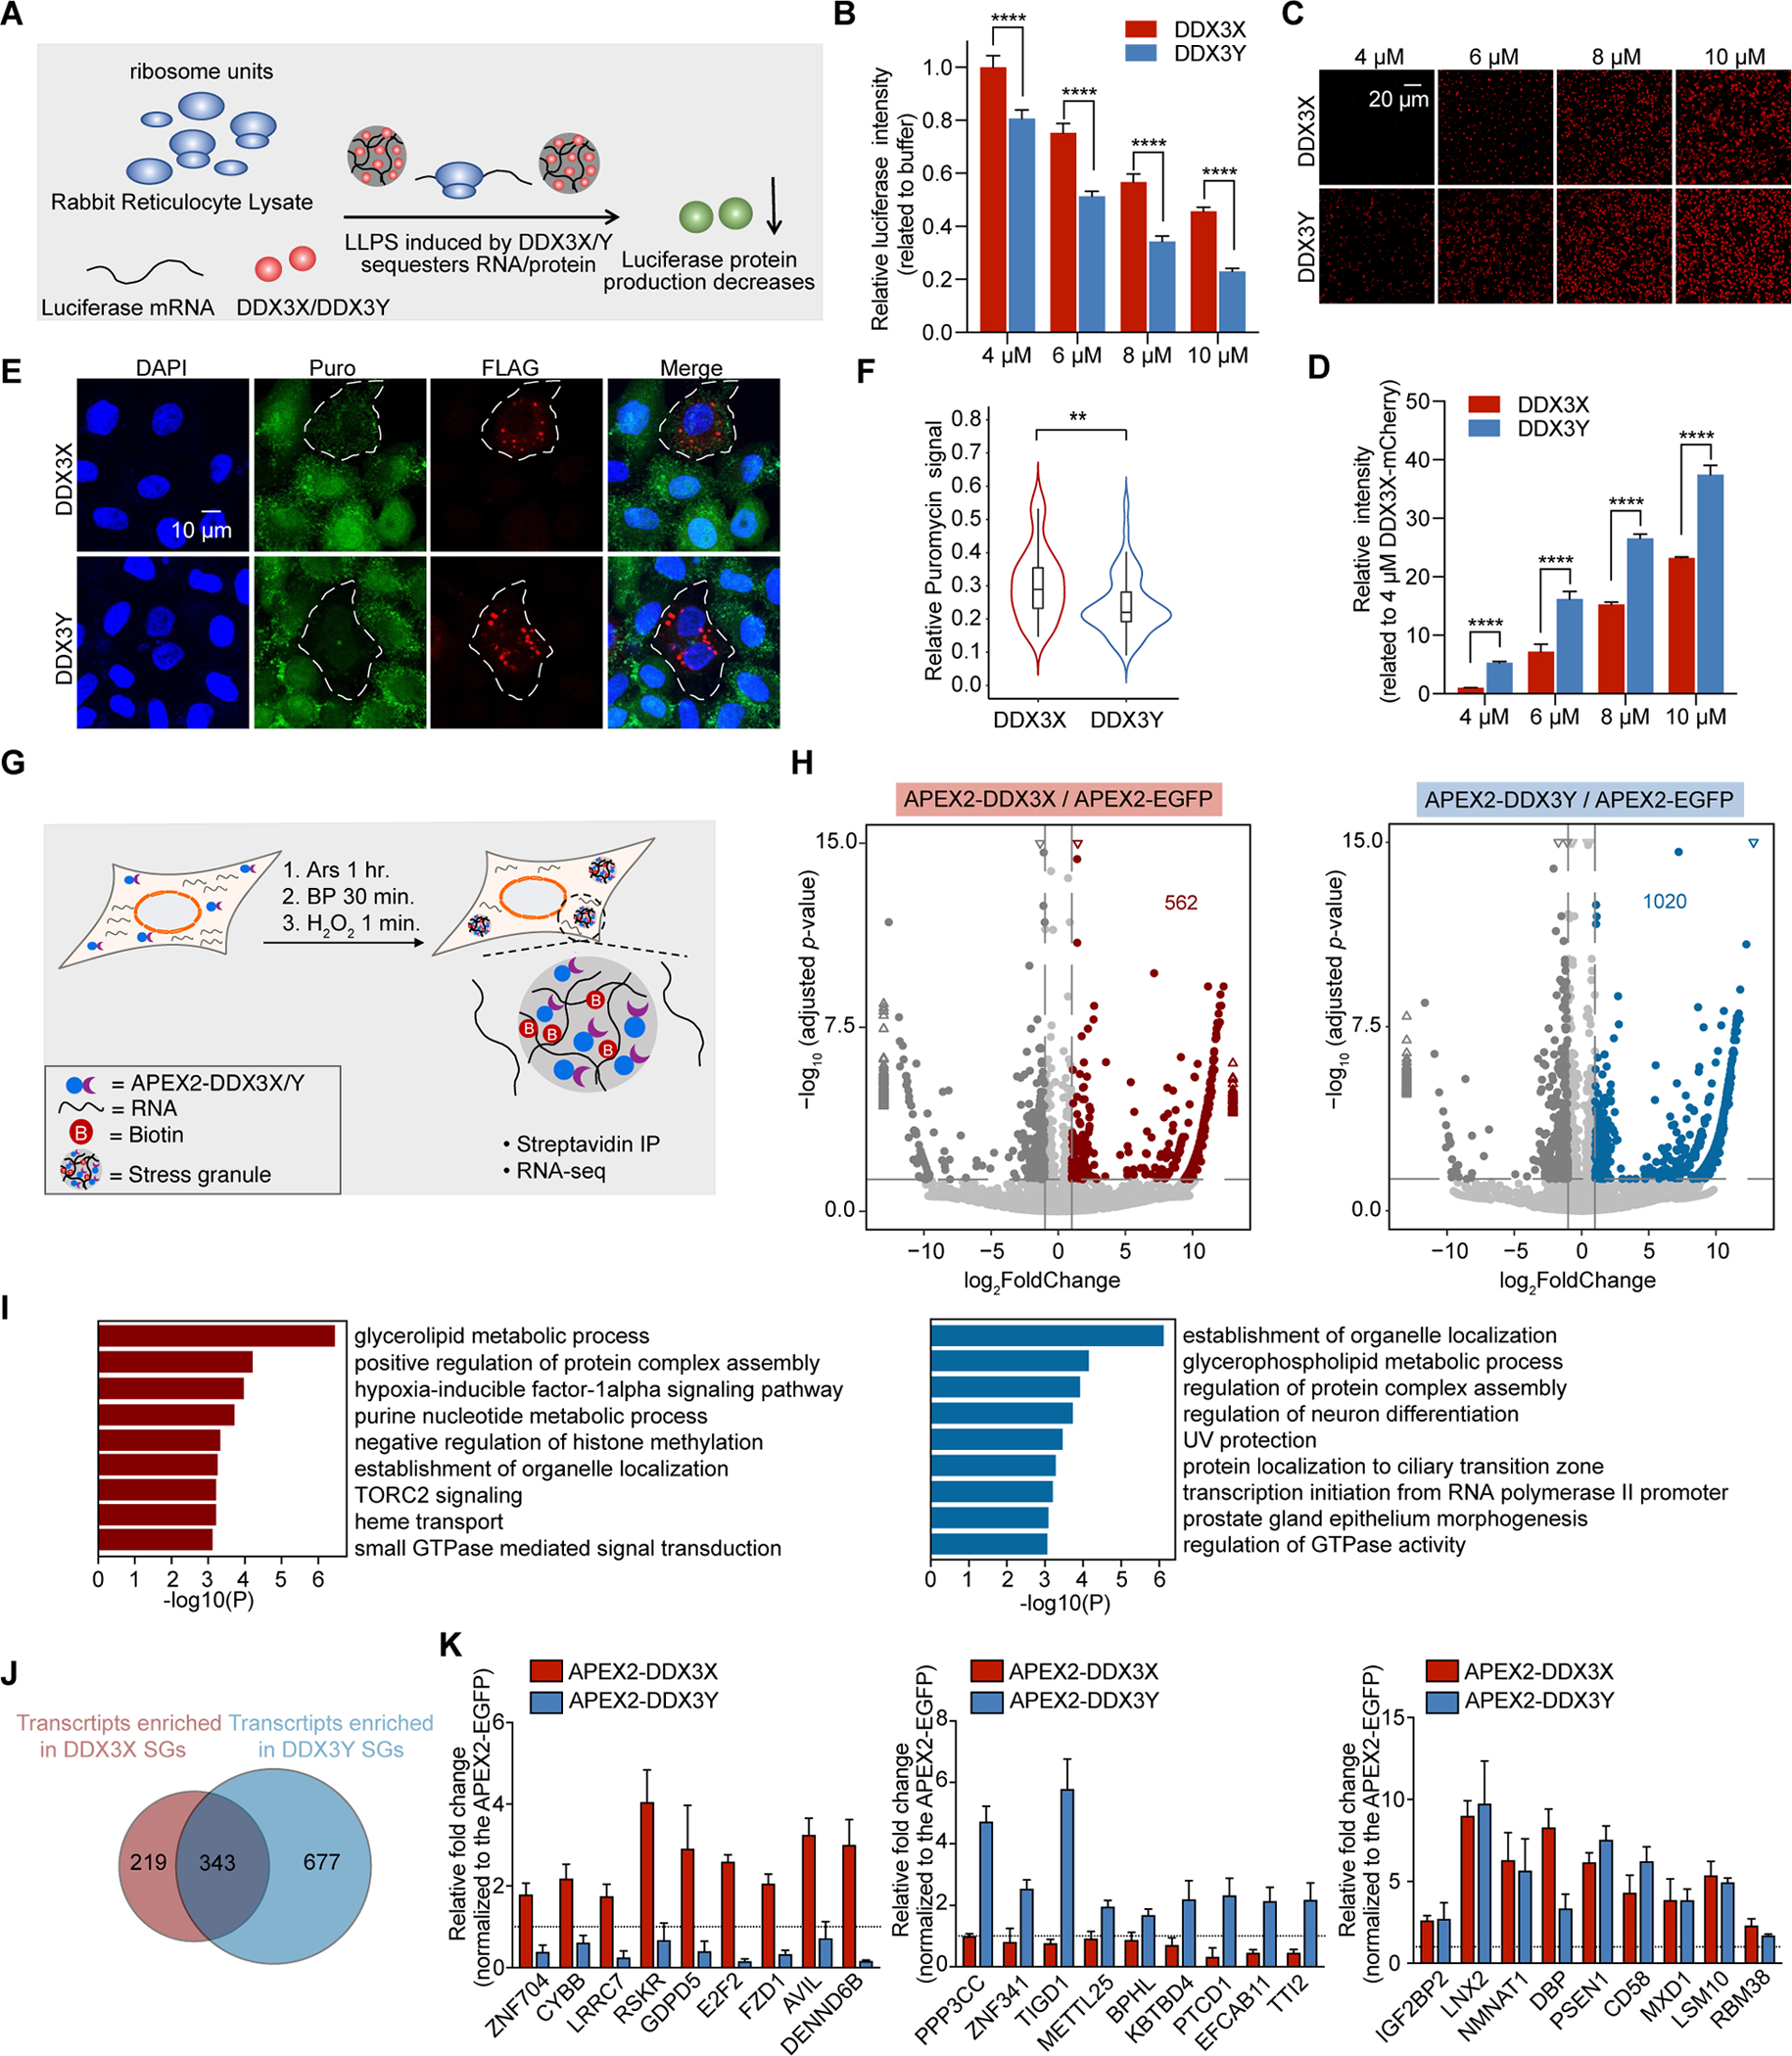
Figure 5. DDX3X and DDX3Y condensation inhibit the translation of luciferase RNA, and DDX3X- and DDX3Y-positive SGs have shared and unique RNA constituents in cells.

(A) Schematic illustration of the in vitro translation assay.
(B) In vitro translation inhibition at the indicated concentrations of DDX3X-mCherry or DDX3Y-mCherry. p values were determined by two-tailed t-test; ****p < 0.0001.
(C) DDX3X-mCherry and DDX3Y-mCherry phase separation in the reticulocyte assay at each indicated concentration; scale bar, 20 μm.
(D) Quantification of the total integrated intensity of different condensates shown in Figure 5C.
(E) Puromycin incorporation assay to determine the extent of translation repression in cells with DDX3X-positive SGs and DDX3Y-positive SGs. The white outlines indicate the cells which express exogenous DDX3X or DDX3Y.
(F) Quantification of puromycin signal in Figure 5E. Only cells expressing exogenous DDX3X or DDX3Y were selected, and the total puromycin signal in each cell was quantified. The total puromycin signals in neighboring cells not expressing exogenous DDX3X or DDX3Y were quantified similarly and used to normalize the data. p-value was determined by two-tailed t-test; **p < 0.01.
(G) Schematic illustration of APEX2-mediated proximity labeling reaction.
(H) Volcano plots showing differential RNA enrichment in streptavidin pull-downs from APEX2-DDX3X (left) and APEX2-DDX3Y (right) expressing cells compared to APEX2-EGFP expressing cells after 500 μM arsenite treatment for 1 hr. Differentially expressed genes are shown in red and blue for APEX2-DDX3X-enriched and APEX2-DDX3Y-enriched RNAs respectively (adjusted p < 0.05, log2 fold change > 1) and dark gray for APEX2-DDX3X-depleted and APEX2-DDX3Y-depleted RNAs (adjusted p < 0.05, log2 fold change < −1). The rest of the RNAs are shown in light gray for both DDX3X and DDX3Y. The triangles represent the transcripts with log2 fold change > 13 or log2 fold change < −13 in the X-axis; −log10 adjusted p >15 in the Y-axis.
(I) Gene Ontology (GO) analysis of the differentially enriched RNA groups in Figure 5E; red: APEX2-DDX3X-enriched RNAs; and blue: APEX2-DDX3Y-enriched mRNAs.
(J) Venn diagram quantifying the overlapping and distinct RNA clients enriched by APEX2-DDX3X and APEX2-DDX3Y after arsenite treatment.
(K) Relative fold change of select RNAs used to conduct RT-qPCR validation of the sequencing results.
See also Figure S5.
