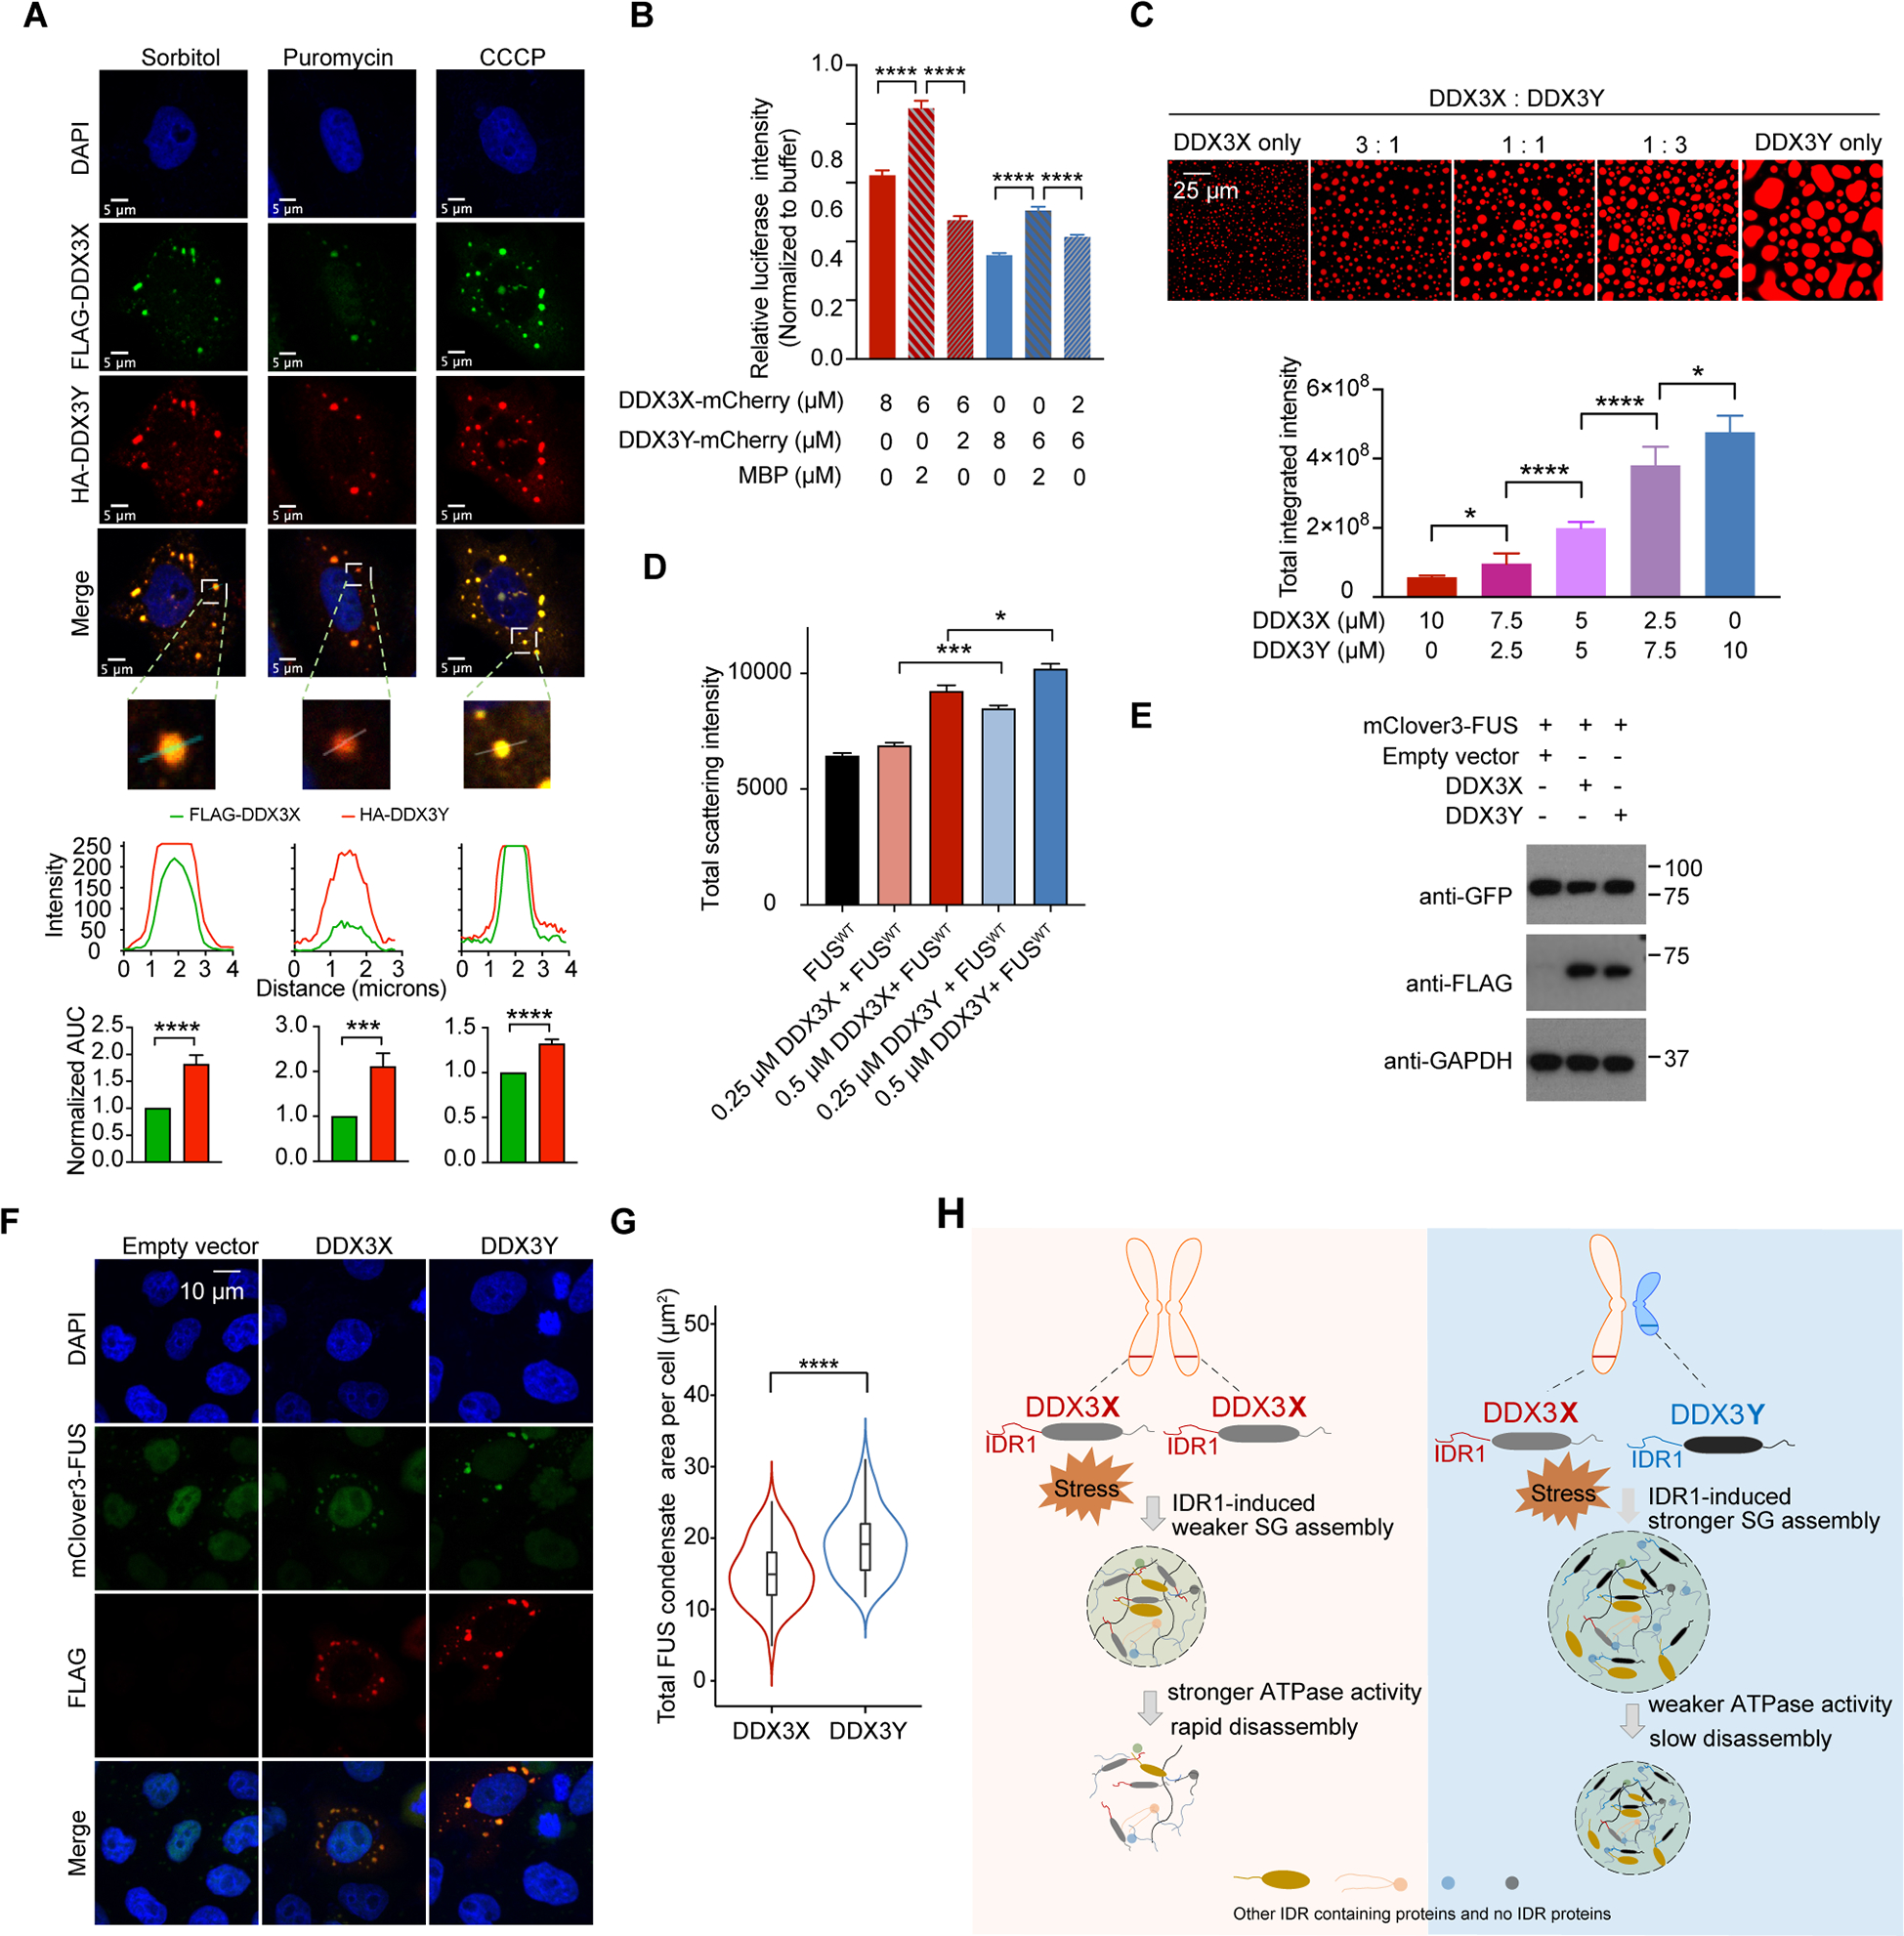
Figure 6. A combination of DDX3X and DDX3Y shows a stronger propensity of LLPS and translation repression than DDX3X alone; and DDX3Y enhances FUS aggregation and accelerates TDP-43 aggregation more than DDX3X.

(A) Immunofluorescence images of SGs containing both FLAG-DDX3X and HA-DDX3Y in HeLa cells treated with sorbitol, puromycin, or CCCP. Below each image, traces of fluorescence intensity profiles through positions denoted by the white lines in the merged images. The area under the curve (AUC) normalized to that of FLAG-DDX3X is plotted for each intensity profile and shows that the signal from HA-DDX3Y is consistently higher than the signal from FLAG-DDX3X.
(B) A mixture of DDX3X-mCherry and DDX3Y-mCherry at the annotated concentrations differentially repress in vitro translation of luciferase RNA. Overall, DDX3Y represses translation more than DDX3X. p values were determined by two-tailed t-test; ****p < 0.0001.
(C) In vitro droplet formation of recombinant DDX3X-mCherry and DDX3Y-mCherry at the annotated ratios in the presence of 200 ng/μL poly(U)-RNA (top panel). Scale bar, 25 μm. Quantification of the total integrated intensity of each type of condensate (bottom panel). p values were determined by two-tailed t-test; *p < 0.05, ****p < 0.0001.
(D) DDX3Y more strongly promotes FUS aggregation than DDX3X in vitro. The area under the curve for each time course of light scattering at 395 nm in Figure S6E was used to compare the extent of aggregation for each condition. p values were determined by two-tailed t-test; *p < 0.05, ***p < 0.001.
(E) Western blots showing the expression of DDX3X and DDX3Y in DOX-inducible stable cell lines expressing mClover3-FUS.
(F) Representative images showing the localization of Flag-DDX3X, Flag-DDX3Y, and mClover-FUS upon arsenite treatment (500 μm, 1 hr). Scale bar, 10 μm.
(G) The total area of granules containing mClover3-FUS and Flag-DDX3X or granules containing mClover3-FUS and Flag-DDX3Y per cell was quantified (n = 50 cells in total, from three biologically independent experiments). p values were determined by a two-tailed t-test; ****p < 0.0001.
(H) Schematic illustration of how sexually dimorphic RNA helicases DDX3X and DDX3Y differentially regulate RNA translation through phase separation.
See also Figure S6.
