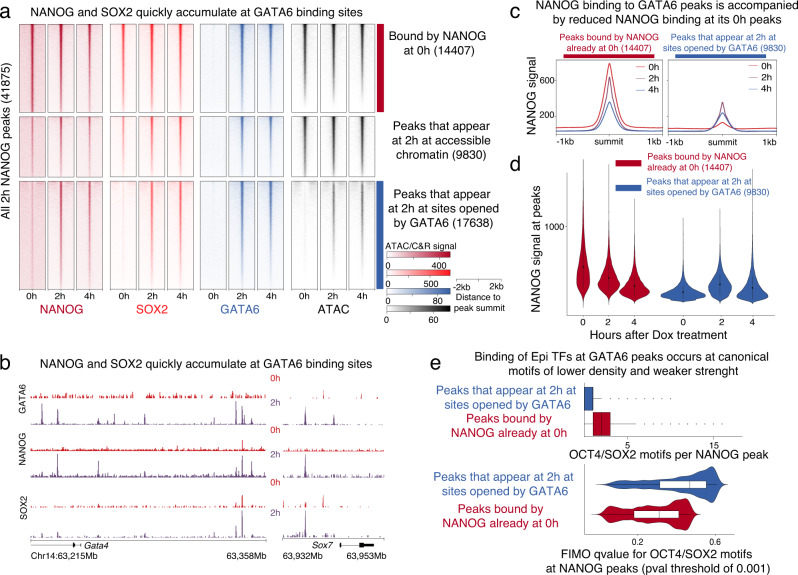
Fig. 4. Evicted pluripotency factors transiently occupy GATA6-bound PrE regions.
a Heatmap showing NANOG, SOX2, and GATA6 binding, together with ATAC signal at regions of the genome bound by NANOG at 2 h. These NANOG peaks were divided in three types: occupied already at 0 h (cluster 1-red), bound de novo by NANOG at 2 h and accessible at 0 h (cluster 2), and bound de novo by NANOG at sites closed at 0 h (cluster 3 -blue). b Representative browser view showing the de novo recruitment of NANOG and SOX2 at 2 h at GATA6 peaks found at putative CREs controlling PrE genes GATA4 and SOX7. c Median profile plots showing a reduction in NANOG binding at NANOG 0 h peaks (left panel, cluster 1 from A) with a simultaneous increase in NANOG binding at peaks opened by GATA6 binding (right panel, cluster 3 from A). d NANOG CUT&RUN signal from 0, 2, and 4 h post Dox induction plotted at peaks comprising clusters 1 and 3 in 4a. The violin plot shows a decrease of read density at cluster 1 peaks with a simultaneous increase at cluster 3 peaks. e Peak per motif density and strength of OCT4-SOX2 binding motifs within NANOG peaks that appear at 2 h (blue) compared to NANOG peaks defined at 0 h (red). Motif strength is represented by the q-value of the FIMO analysis comparing the motif found at peaks to the consensus sequence. Boxplots show minimum, maximum, median, first, and third quartiles. Source data are provided as a Source Data file.

