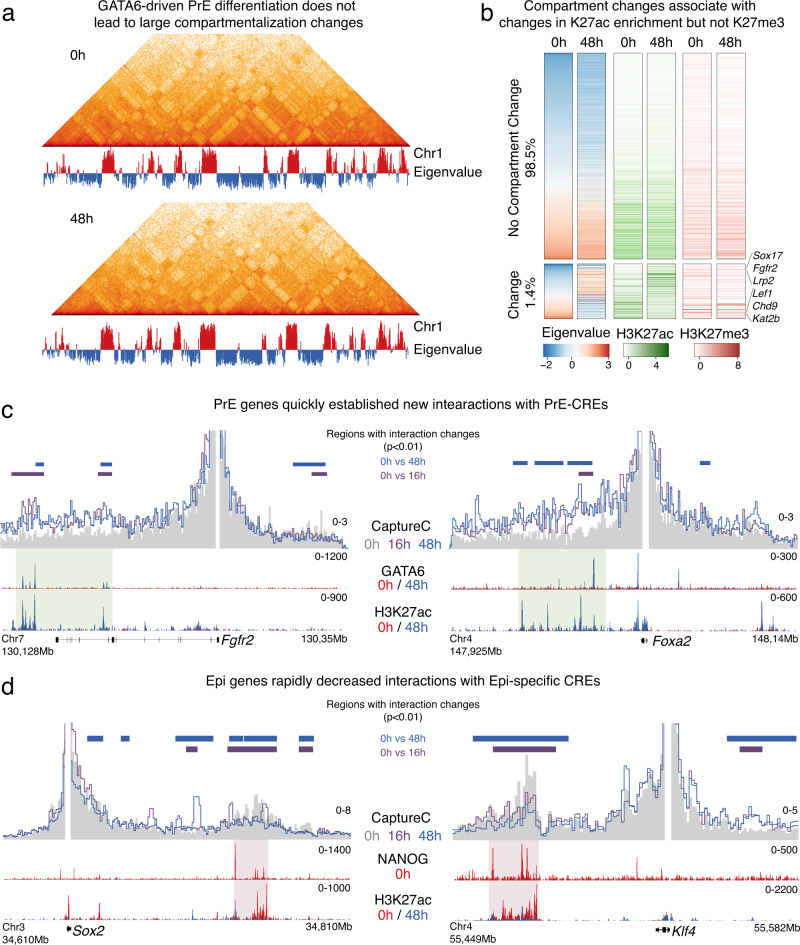
Fig. 6. GATA6-induced chromatin changes were followed by fast rewiring of interactions between Epi and PrE-specific genes with their CREs.
a Intra-chromosomal interactions over chromosome 1 detected by Hi-C and first principal component eigenvalue show that nuclear compartments composition was mostly unchanged during differentiation. b Heatmap showing eigenvalues of first principal component of Hi-C performed at 0 and 48 h. Less than 2% of all 250kb-bins changed their compartment during PrE differentiation (bottom cluster). Most 250 kb-bins did not change compartment (top cluster). Clusters are not represented to scale. Changes in compartments were associated with changes in H3K27ac but no changes were observed for H3K27me3 levels. Bins that changed from compartment B to A gained K27ac signal and bins that changed from B to A, lost this histone modification. Bins were sorted based on eigenvalue at 0 h. Examples of Epi and PrE-specific genes whose compartment localization changed during differentiation are shown. c, d In contrast to stable compartment status, interactions between gene promoters and their putative CREs were quickly remodeled within 16 h of GATA6 expression. PrE genes shown in c, quickly increased interactions with sites bound by GATA6 that gained H3K27ac during differentiation. Epi genes in contrast, reduced interactions with CRES that were occupied by NANOG at 0 h and that lost H3K27ac following GATA6 expression. Capture-C data is shown as the average signal of two replicates using bins of 1 kb. Green shaded area represents putative CREs showing increased interactions with PrE-specific genes while red shaded areas highlight Epi-CREs that lose interactions with putative Epi-specific genes. P values were calculated using the Wald test in DESeq2 and comparing Capture-C signal of 2 replicates over overlapping 5 kb windows across the regions shown in this figure. Comparisons were done between 0 h and either 16 h or 48 h. Adjusted p values using the FDR/Benjamini-Hochberg option in DE-Seq2 that were lower than 0.01 were considered as significant. Horizontal bars represent windows considered as statistically significantly different for these comparisons.

