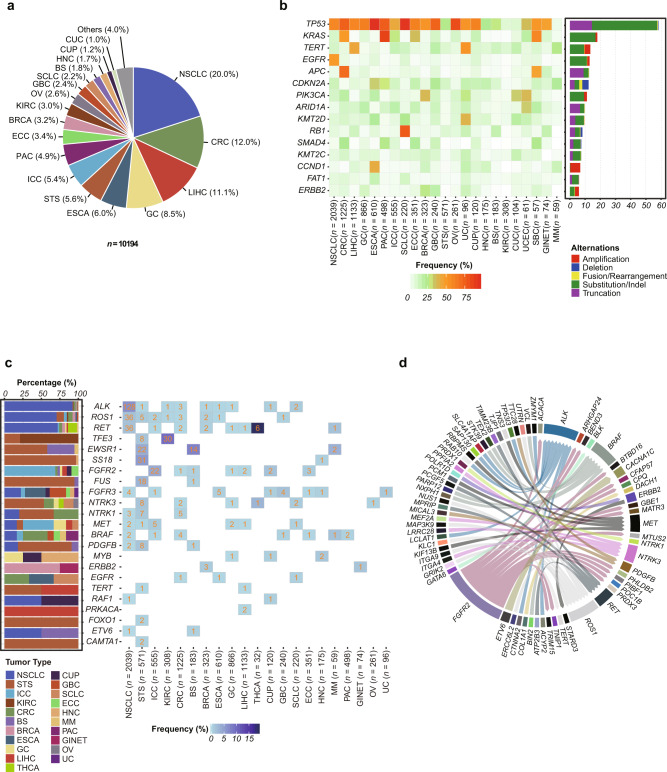
Fig. 1. Overview of the mutational landscape of solid tumors from Chinese patients.
a Distribution of tumor types among cases successfully sequenced from 10,194 patients. b Recurrent somatic alterations across common tumor types. The top 15 Tier 1 Cancer Gene Census oncogenes and tumor suppressor genes with a cohort-level variation frequency of ≥6% were shown, in descending order. Bars represent the percent of cases within each tumor type having at least 1 of 5 different classes of genomic alterations. c Genes recurrently rearranged to form putative gene fusions were displayed across principal tumor types. The tumor type-specific distribution of these genes was presented on the left side (various colors represent different tumor types). The number of corresponding gene fusions in each tumor type was shown in the right boxes, and the frequency was shown in gradient blue. d Gene fusions across multiple tumor types. A total of 57 driver-partner relationships were detected spanning 71 genes. The thickness of the line between two genes implied the relative count.

