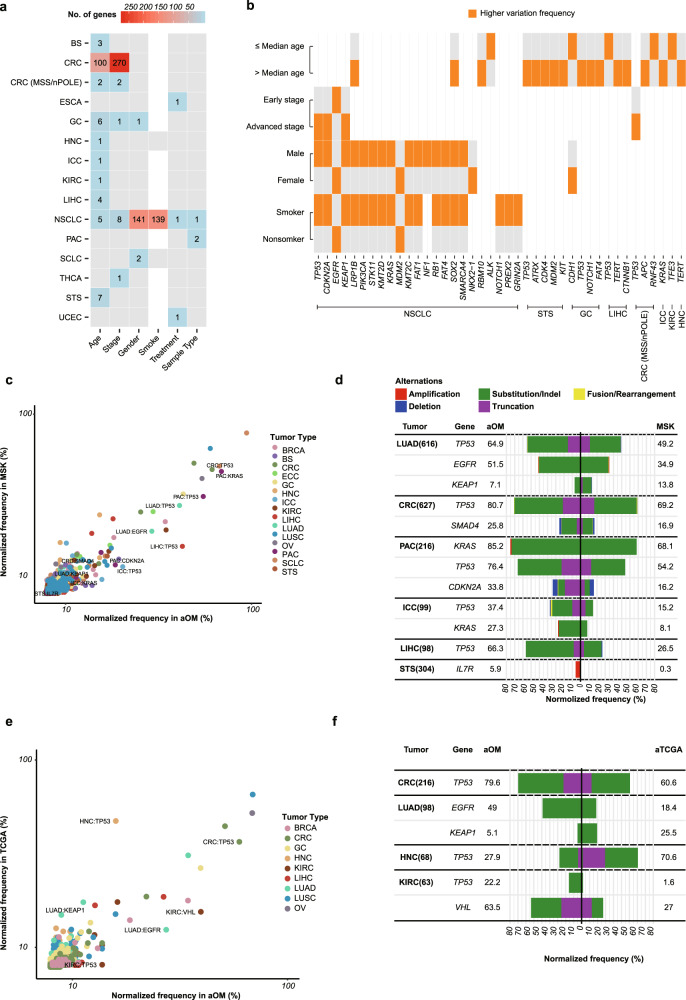
Fig. 2. Analysis of somatic altered genes.
a Numbers of correlated altered genes with six clinical features across tumor types. Only genes with significant differences (FDR < 0.05) between two groups of clinical features were calculated. The “age” feature included the younger patient group and the older patient group, separated by the median initial diagnosis age of patients of each tumor type. The “stage” feature included early-stage cancer group and advanced-stage cancer group. The “smoke” feature, including the smoker group (current smokers and former smokers) and nonsmoker group (never-smokers), was analyzed in lung cancers (NSCLC and SCLC) and head and neck cancers (HNC). The “treatment” feature included treatment-naive group and the pretreated group. The “sample type” feature included the primary sample group and metastatic/recurrent sample group. b Correlation between Tier 1 Cancer Gene Census genes and clinical features. Genes with significant differences (FDR < 0.05, number of each group >60, and sum of variation frequencies >10%) between two feature groups were shown. The group with a higher variation frequency in each clinical feature was labeled in orange. c Frequency of altered gene in 15 comparable tumor types between the aOM cohort and MSK cohort. d Comparison of significantly different altered genes (FDR < 0.05) between the aOM cohort (left) and MSK cohort (right). Altered genes whose sum of frequencies in the two cohorts were displayed. The alteration frequencies (%) of specific genes were shown in the “aOM” and “MSK” columns. e Frequency of altered gene in 9 comparable tumor types between the aOM cohort and aTCGA cohort. f Comparison of significantly different altered genes (FDR < 0.05) between the aOM cohort (left) and MSK cohort (right). Altered genes whose sum of frequencies in the two cohorts were displayed.

