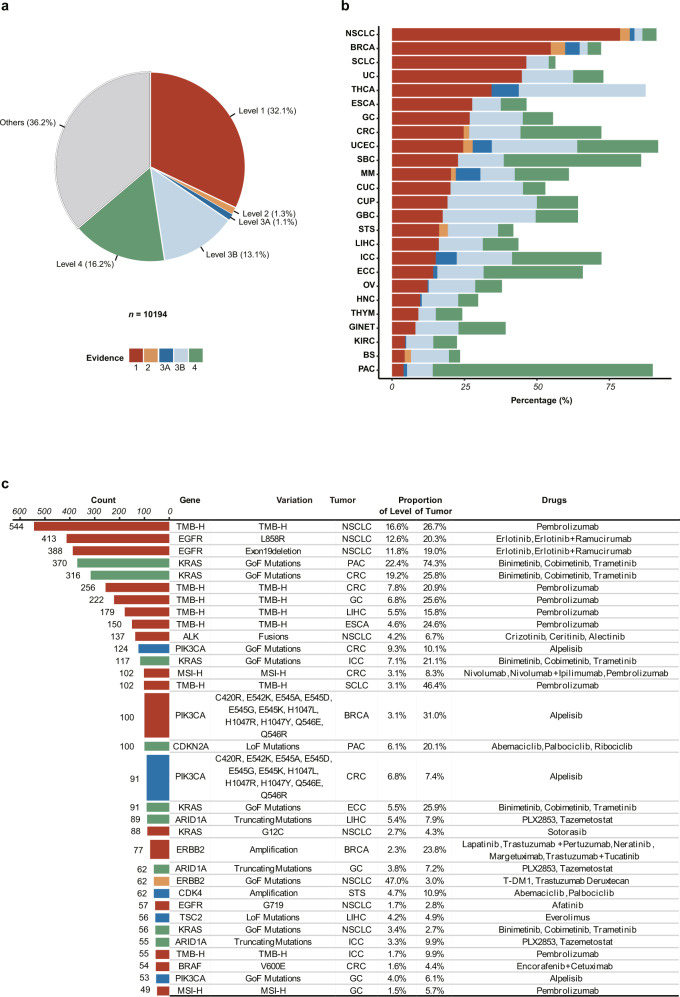
Fig. 4. Clinical actionability of somatic alterations in the OM cohort.
a Variants were assigned to different levels of clinical actionability according to OncoKB. The distribution of the highest level of actionable variants across all patients was shown in the pie chart. The colors representing each level were used throughout the other panels in this figure. b Distribution of highest level of actionable variants across tumor types. c Details of the 30 most common actionable variants, proportions of levels in corresponding tumor types, and their potential sensitive drugs. The numbers of patients in each level were shown in the bar graph. The right table showed genes, variants, and the tumor type for each level of clinical actionability, as well as the proportion of patients in the corresponding tumor type and level. Potential sensitive drugs suggested by biomarkers were also shown in the table.

