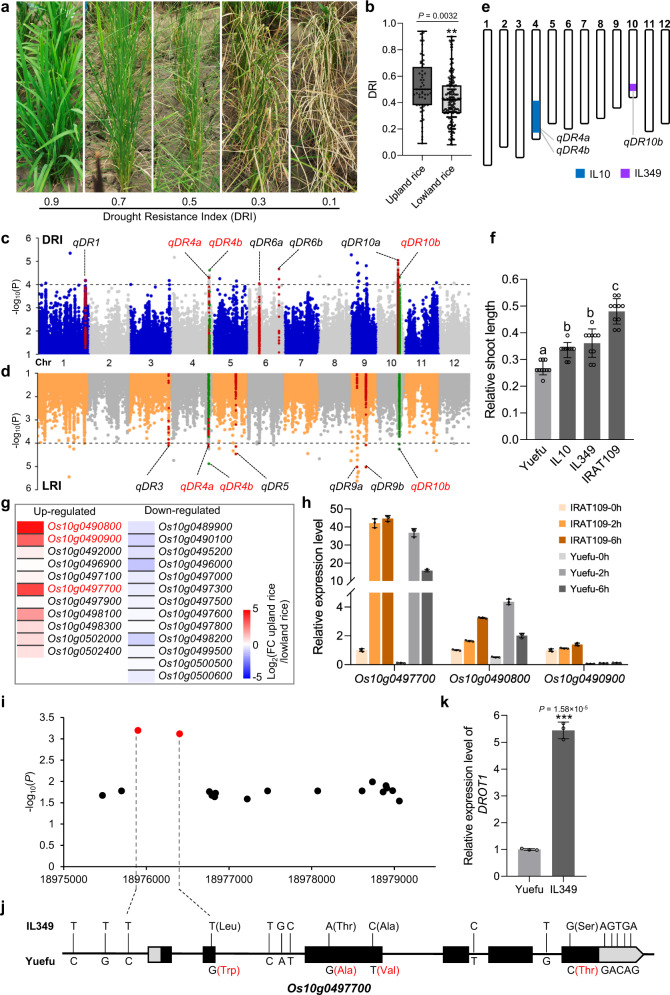
Fig. 1. Dissecting the drought resistance inheritance and cloning of DROT1.
a Phenotypes of accessions corresponding to different DRI. b DRI of upland rice (n = 59 accessions) and lowland rice (n = 212 accessions) subgroups. In each box plot (drawn by GraphPad Prism 8 software), the center line indicates the median, the edges of the box represent the first and third quartiles, and the whiskers extend to span a 1.5 interquartile range from the edges. c, d Manhattan plot of GWAS for DRI (c) and LRI (d). e Chromosome diagram of introgression lines IL349 and IL10. Blank area represents the recipient genome background of Yuefu (lowland rice). Purple rectangle indicates the donor segment of IRAT109 (upland rice) from 18.7 to 19.3 Mb on chromosome 10, and blue rectangle indicates the segment of IRAT109 from 26 to 31 Mb on chromosome 4. Each introgression line contains single segment of IRAT109. f Relative shoot length of seedlings treated with 15% PEG6000 for 10 days. Data represent means ± s.d. (n = 10 plants). g Heat map of 25 up- or down-regulated genes in upland rice compared with lowland rice in the candidate region based on the transcriptome data. FC upland rice/lowland rice represents the average expression value of two upland rice divided by that of two lowland rice. h Dehydration stress induced expression of genes in IRAT109 and Yuefu. Two-week-old seedlings were dehydrated under room condition for 0, 2 and 6 h. Data represent means ± s.d. (n = 3 biological replicates). i Association analysis of genetic variation in Os10g0497700 with DRI. Red dots indicate the most significant SNPs. j Allelic variation of Os10g0497700 between IL349 and Yuefu. k Expression of DROT1 in IL349 and Yuefu detected in leaf tissues of two-week-old seedlings grown under normal conditions. Data represent means ± s.d (n = 3 biological replicates). In b, k, significant differences were determined by two-tailed Student’s t-tests (**P < 0.01, ***P < 0.001). In f, different letters indicate significant differences (P = 0.01, one-way ANOVA). Source data are provided as a Source Data file.

