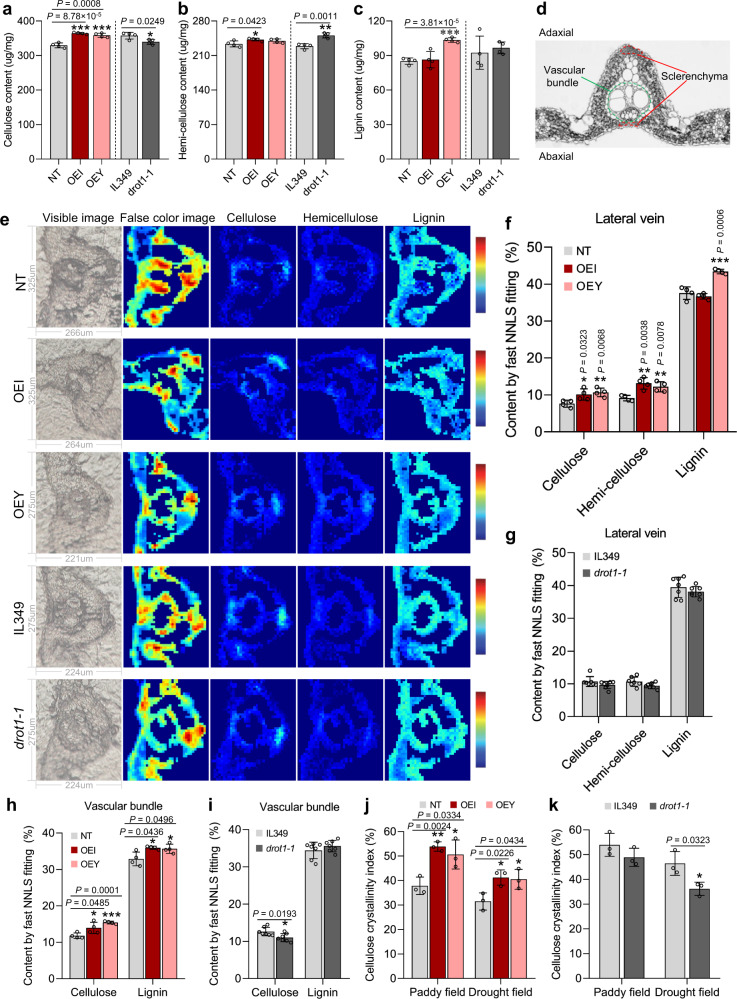
Fig. 4. DROT1 affects cell wall properties under drought stress condition.
a–c Quantification of cell wall components of rice plants by chemical analysis. The contents of cellulose (a), hemi-cellulose (b), and lignin (c) obtained from leaf tissues of the indicated plants grown in drought field. Data are means ± s.d. (n = 4 biological replicates). d Microstructural diagram of cross section of lateral vein in rice leaf. Green-circled area represents vascular bundle, red-circled area represents sclerenchyma. e Fast NNLS fitting images of lateral veins in cross section of leaves grown in drought field. From left to right are visible images, false color images (reflecting the location and density of spectral distribution in the range of 1800−800 cm−1 throughout the lateral vein, comparisons cannot be made between different rice plants vertically), spectrogram of characterized cellulose, hemi-cellulose and lignin content. The colors of these three columns reflects the relative content of each target component. In this arrangement, comparisons can be made between various components horizontally as well as between different plants vertically. f–i Semi-quantitative analysis of cell wall components. The contents of cellulose, hemi-cellulose and lignin determined by fast NNLS fitting for lateral veins of e (f, g). The cellulose and lignin content based on fast NNLS fitting for the segmented vascular bundle from e (h, i). Data are means ± s.d. (n = 4 biological replicates for f, h, and n = 7 biological replicates for g, i). j, k Relative crystallinity index (RCI) of cellulose in leaf samples of NT, OEI and OEY (j), drot1-1 and IL349 (k) from paddy field and drought field, respectively. It is presented as percentage of crystalline in total cell wall components. Data are means ± s.d. (n = 3 biological replicates). Asterisks indicate statistical significance by two-tailed Student’s t-tests (*P < 0.05, **P < 0.01, ***P < 0.001). Source data are provided as a Source Data file.

