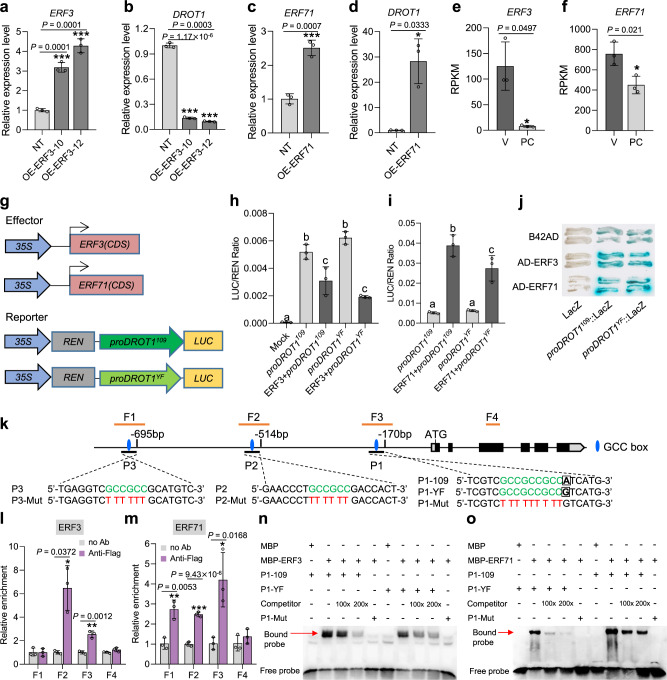
Fig. 5. DROT1 is directly regulated by ERF3 and ERF71.
a, b Expression of ERF3 (a) and DROT1 (b) in ERF3-overexpressing transgenic lines compared with that in NT (negative transgenic control with Nipponbare background). Data are means ± s.d. (n = 3 biological replicates). c, d Expression of ERF71 (c) and DROT1 (d) in ERF71-overexpressing transgenic lines compared with that in NT. Data are means ± s.d. (n = 3 biological replicates). e, f The differentiated expression of ERF3 (e) and ERF71 (f) in vascular bundles and parenchyma cells. Data are means ± s.d. (n = 3 biological replicates). g–i Transient expression assays of dual-luciferase by co-transfecting rice protoplasts with the vectors shown in g. The transcription activities of the reporters were significantly repressed by ERF3 (h), but were strikingly activated by ERF71 with a higher activation activity for the promoter of DROT1 from IRAT109 (i). Mock, co-transfected with an empty reporter construct and an empty effector construct. proDROT1109/ proDROT1YF, co-transfected with a reporter construct and an empty effector construct. 109, IRAT109; YF, Yuefu. Data are means ± s.d. (n = 3 biological replicates). Different letters indicate statistically significant differences at P = 0.01 by one-way ANOVA test. j Y1H assay. ERF3 and ERF71 can bind to the promoter of DROT1. n = 3 independent experiments. k Schematic diagram showing the three GCC box regions used for EMSA in the promoter of DROT1, namely P1, P2 and P3. Green letters in the three probe sequences indicate the core motif of GCC box, red letters indicate the substituted nucleotide sequences in the mutated probes. Black boxes indicate the functional SNP s18975900. F1-F4 are the four fragments used in ChIP-qPCR. l, m ChIP-qPCR analysis of ERF3 (l) and ERF71 (m) enrichment of fragments in the promoter of DROT1. Amplified fragments by qPCR are marked with F1-F4 in k. Values are means ± s.d. (n = 3 biological repeats). n, o EMSA shows ERF3 and ERF71 directly bind to the GCC box of P1 in the promoter of DROT1. Unlabeled wild type probes were used as competitors. n = 4 independent experiments. Asterisks indicate statistical significance by two-tailed Student’s t-tests (*P < 0.05, **P < 0.01, ***P < 0.001). Source data are provided as a Source Data file.

