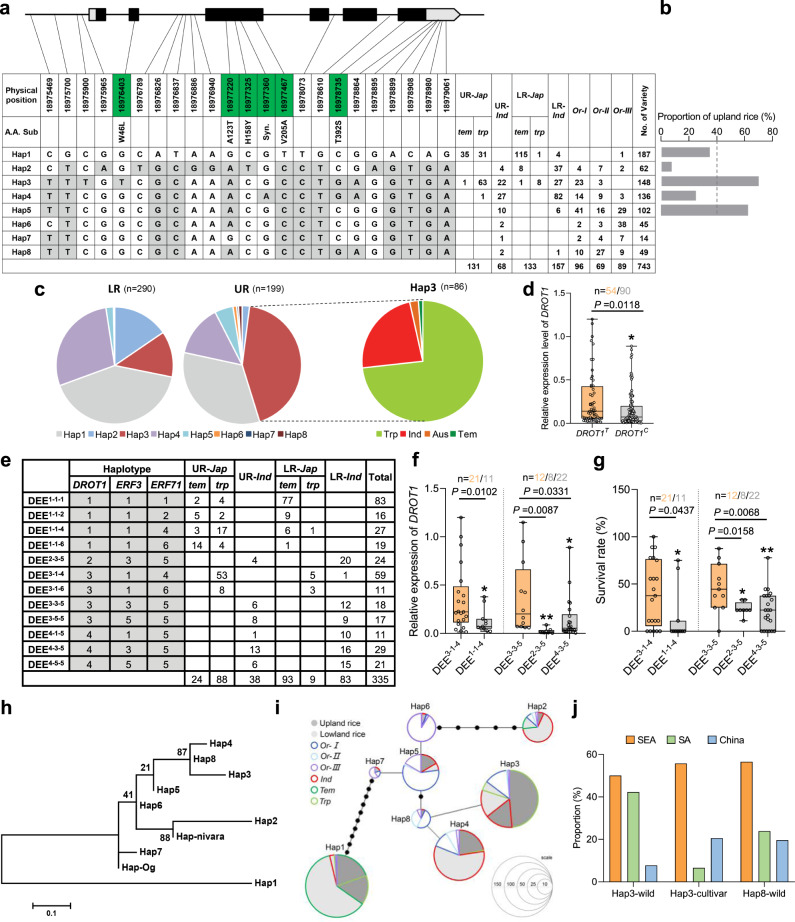
Fig. 7. Haplotype analysis and origin of DROT1.
a Haplotypes of DROT1 in natural population. Nucleotide variations in the coding region are labeled in green boxes. The DROT1 nucleotide sequences of accessions in the germplasm were compared with that of Nipponbare (Hap1). The number of varieties for each haplotype (Hap1–8) is shown in the right column. The upland rice IRAT109 belongs to Hap3, and the lowland rice Yuefu shares same haplotype with Nipponbare. UR, upland rice. LR, lowland rice. b Proportion of upland rice in cultivated accessions with Hap1-Hap5. The dashed line represents the average proportion of upland rice in the entire cultivar population. c Distribution of DROT1 haplotypes in lowland rice and upland rice. d Relative expression of DROT1 in DROT1T and DROT1C type accessions under drought stress. DROT1T indicates the accessions with Hap3 as the SNP site s18975900 is “T”; DROT1C indicates the accessions with s18975900 is “C” (non-Hap3 haplotype). Data are means ± s.d. (n = 3 biological replicates). e Combined haplotypes of DROT1-ERF3-ERF71. f Relative expression of DROT1 in accessions with same haplotype of ERF3 and ERF71. Data are means ± s.d. (n = 3 biological replicates). g Survival rates of accessions with same haplotype of ERF3 and ERF71. Data are means ± s.d. (n = 3 biological replicates). In each box plot of d, f, and g, the center line indicates the median, the edges of the box represent the first and third quartiles, and the whiskers extend to span a 1.5 interquartile range from the edges. h Evolutionary relationship of eight haplotypes. O.nivara and O.glaberrima-specific haplotypes were used as outgroups. The scale bar indicates the average number of substitutions per site for different haplotypes. i Haplotype network of DROT1 shown by the minimum-spanning tree. Circle size is proportioned to the number of accessions with a given haplotype. Circle colors represent different rice subspecies. The dark gray inside the circle indicates upland rice, while the light gray indicates lowland rice. j Geographical distribution of rice accessions with Hap3 and Hap8. SEA, South East Asia. SA, South Asia. Statistical significance was calculated by two-tailed Student’s t-test and P-values were indicated in d, f, and g (*P < 0.05, **P < 0.01). Source data are provided as a Source Data file.

