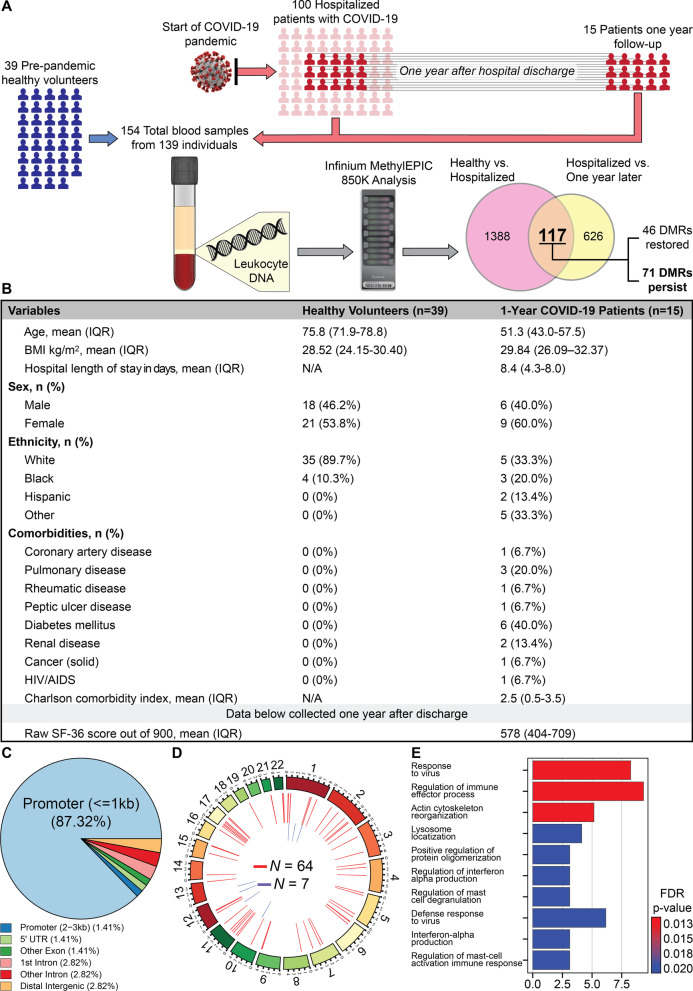
Fig. 1.
A Diagram of data generation and analysis pipeline. See text for details. B Clinical characteristics of participants. To prevent DNA methylation changes caused by asymptomatic SARS-CoV-2 infection, samples were taken from healthy volunteers enrolled in 2017, who were not recalled. IQR is interquartile range. Raw SF-36: Short Form Health Survey involves 36 questions that are divided in 9 domains. Each domain has a maximal score of 100% based on the participants answers, and thus, the optimal score is 900. C Pie chart showing the distribution of DMRs to standard genomic features in percent. 5′UTR=5′ untranslated region. In keeping with the known role of DNA methylation in regulation of gene expression, a preponderance of DMRs is in gene promoter regions. D Circos plot shows the genomic distribution of differentially methylated regions (DMRs) across the human genome (outer ring). Each chromosome is shown as a different color. Relative chromosome size is denoted by the arc bar length (inner rings). Hyper-methylated DMRs are shown in red, and hypo-methylated regions are shown in blue. Sex chromosomes were omitted from the analysis. These results indicate that 71 DNA regions persist differentially methylated one year after hospital discharge in reference to a pre-pandemic healthy control cohort. E Bar graph of the top 10 gene ontological (GO) processes related to the SARS-CoV-2-associated differentially methylated genes that persist abnormal one year after hospital discharge ordered by statistical significance. The X-axis provides the number of SARS-CoV-2 DMR-associated genes that contribute to each GO term. Bar color indicates the FDR P-value by using a Fischer test. These results indicate that the observed DMRs occur in genes that participate in process such as response to virus, regulation of immune processes and others.

