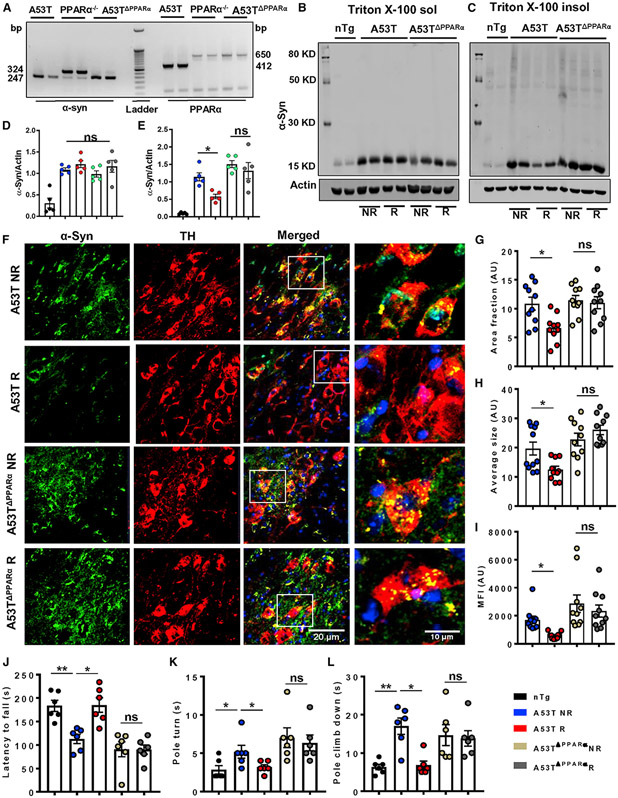
Figure 5. The α-syn pathology is not reduced by treadmill exercise in PPARα-deficient A53T mice.
(A) Homozygous A53T mice were crossed with PPARα−/− mice to generate A53T mice deficient of functional PPARα (A53TΔPPARα).
(B–E) Total α-syn level in Triton X-100 soluble and insoluble fractions isolated from midbrain tissues of A53T and A53TΔPPARα mice was measured by immunoblotting (F1, 16 = 6.83, *p < 0.05 for insoluble fraction, n = 5).
(F) Deposition of aggregated α-syn in nigral TH neurons was evaluated by immunofluorescence followed by confocal imaging.
(G–L) Two sections from each brain per group were used for staining purpose, where α-syn puncta was quantified in at least 10 TH positive cells from each section.
(G–I) Average values of different α-syn parameters including area (F1,36 = 6.21, *p < 0.05), average size (F1,36 = 6.37, *p < 0.05), and MFI of protein aggregates (F1,36 = 4.18, *p < 0.05) obtained from each section of all the groups of mice are shown (n = 5).
(J–L) Movement behavior was examined by rotarod (F1,20 = 7.4, *p < 0.05, J, n = 6) and pole test, where pole turn (F1,20 = 6.30, *p < 0.05, n = 6) and climb-down time (F1,20 = 6.96, *p < 0.05, n = 6) by each mouse were recorded (K and L).
The significance of mean was compared using two-way ANOVA considering NR/R and genotype as two independent factors. F1,20 > Fc and p < 0.05 were considered the statistical significance, where *p < 0.05 and **p < 0.01 indicate significance compared with respective groups; ns, not significant. Data are represented as mean ± SEM.

