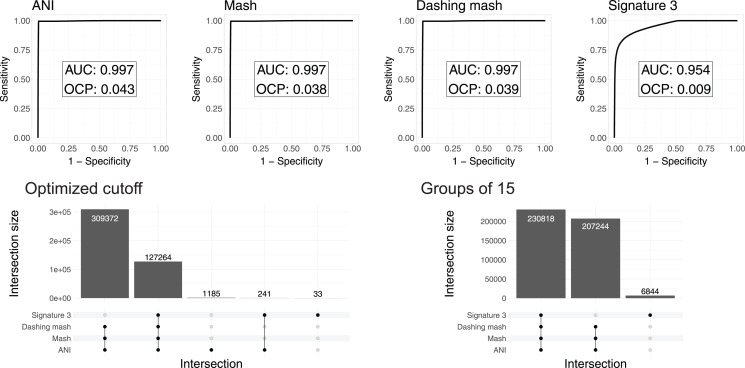
Figure 3. ROC curve analyses.
Top: the area under the curve (AUC) suggests almost perfect species delineation for FastANI, Mash and Dashing mash, with lower performance for DNA signatures. Bottom, left: the UpSet plot compares the genome pairs grouped together after pruning the dendrograms at the specific optimal cut points (OCP) obtained for each program. FastANI, Mash and Dashing shared almost all of the grouped pairs. Bottom, right: after using cutoff to obtain 15 groups with all distances, FastANI, Mash and Dashing produced identical groups.

