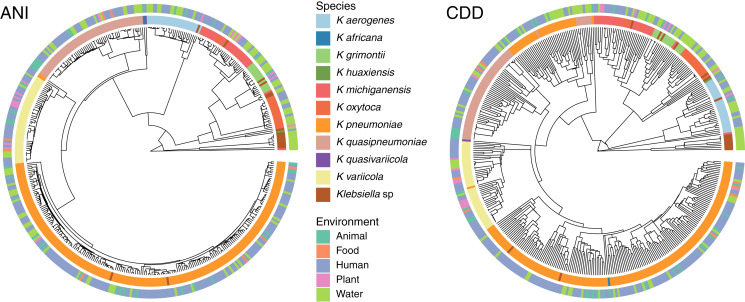
Figure 5. Domain content and isolation source.
Isolation source neither follows species, nor domain content. For illustration purposes, the hierarchy plot used a reduced K. pneumoniae dataset filtered at a Mash distance cutoff of 0.005. Only genomes with isolation source annotations in PATRIC (Davis et al., 2020) are shown.

