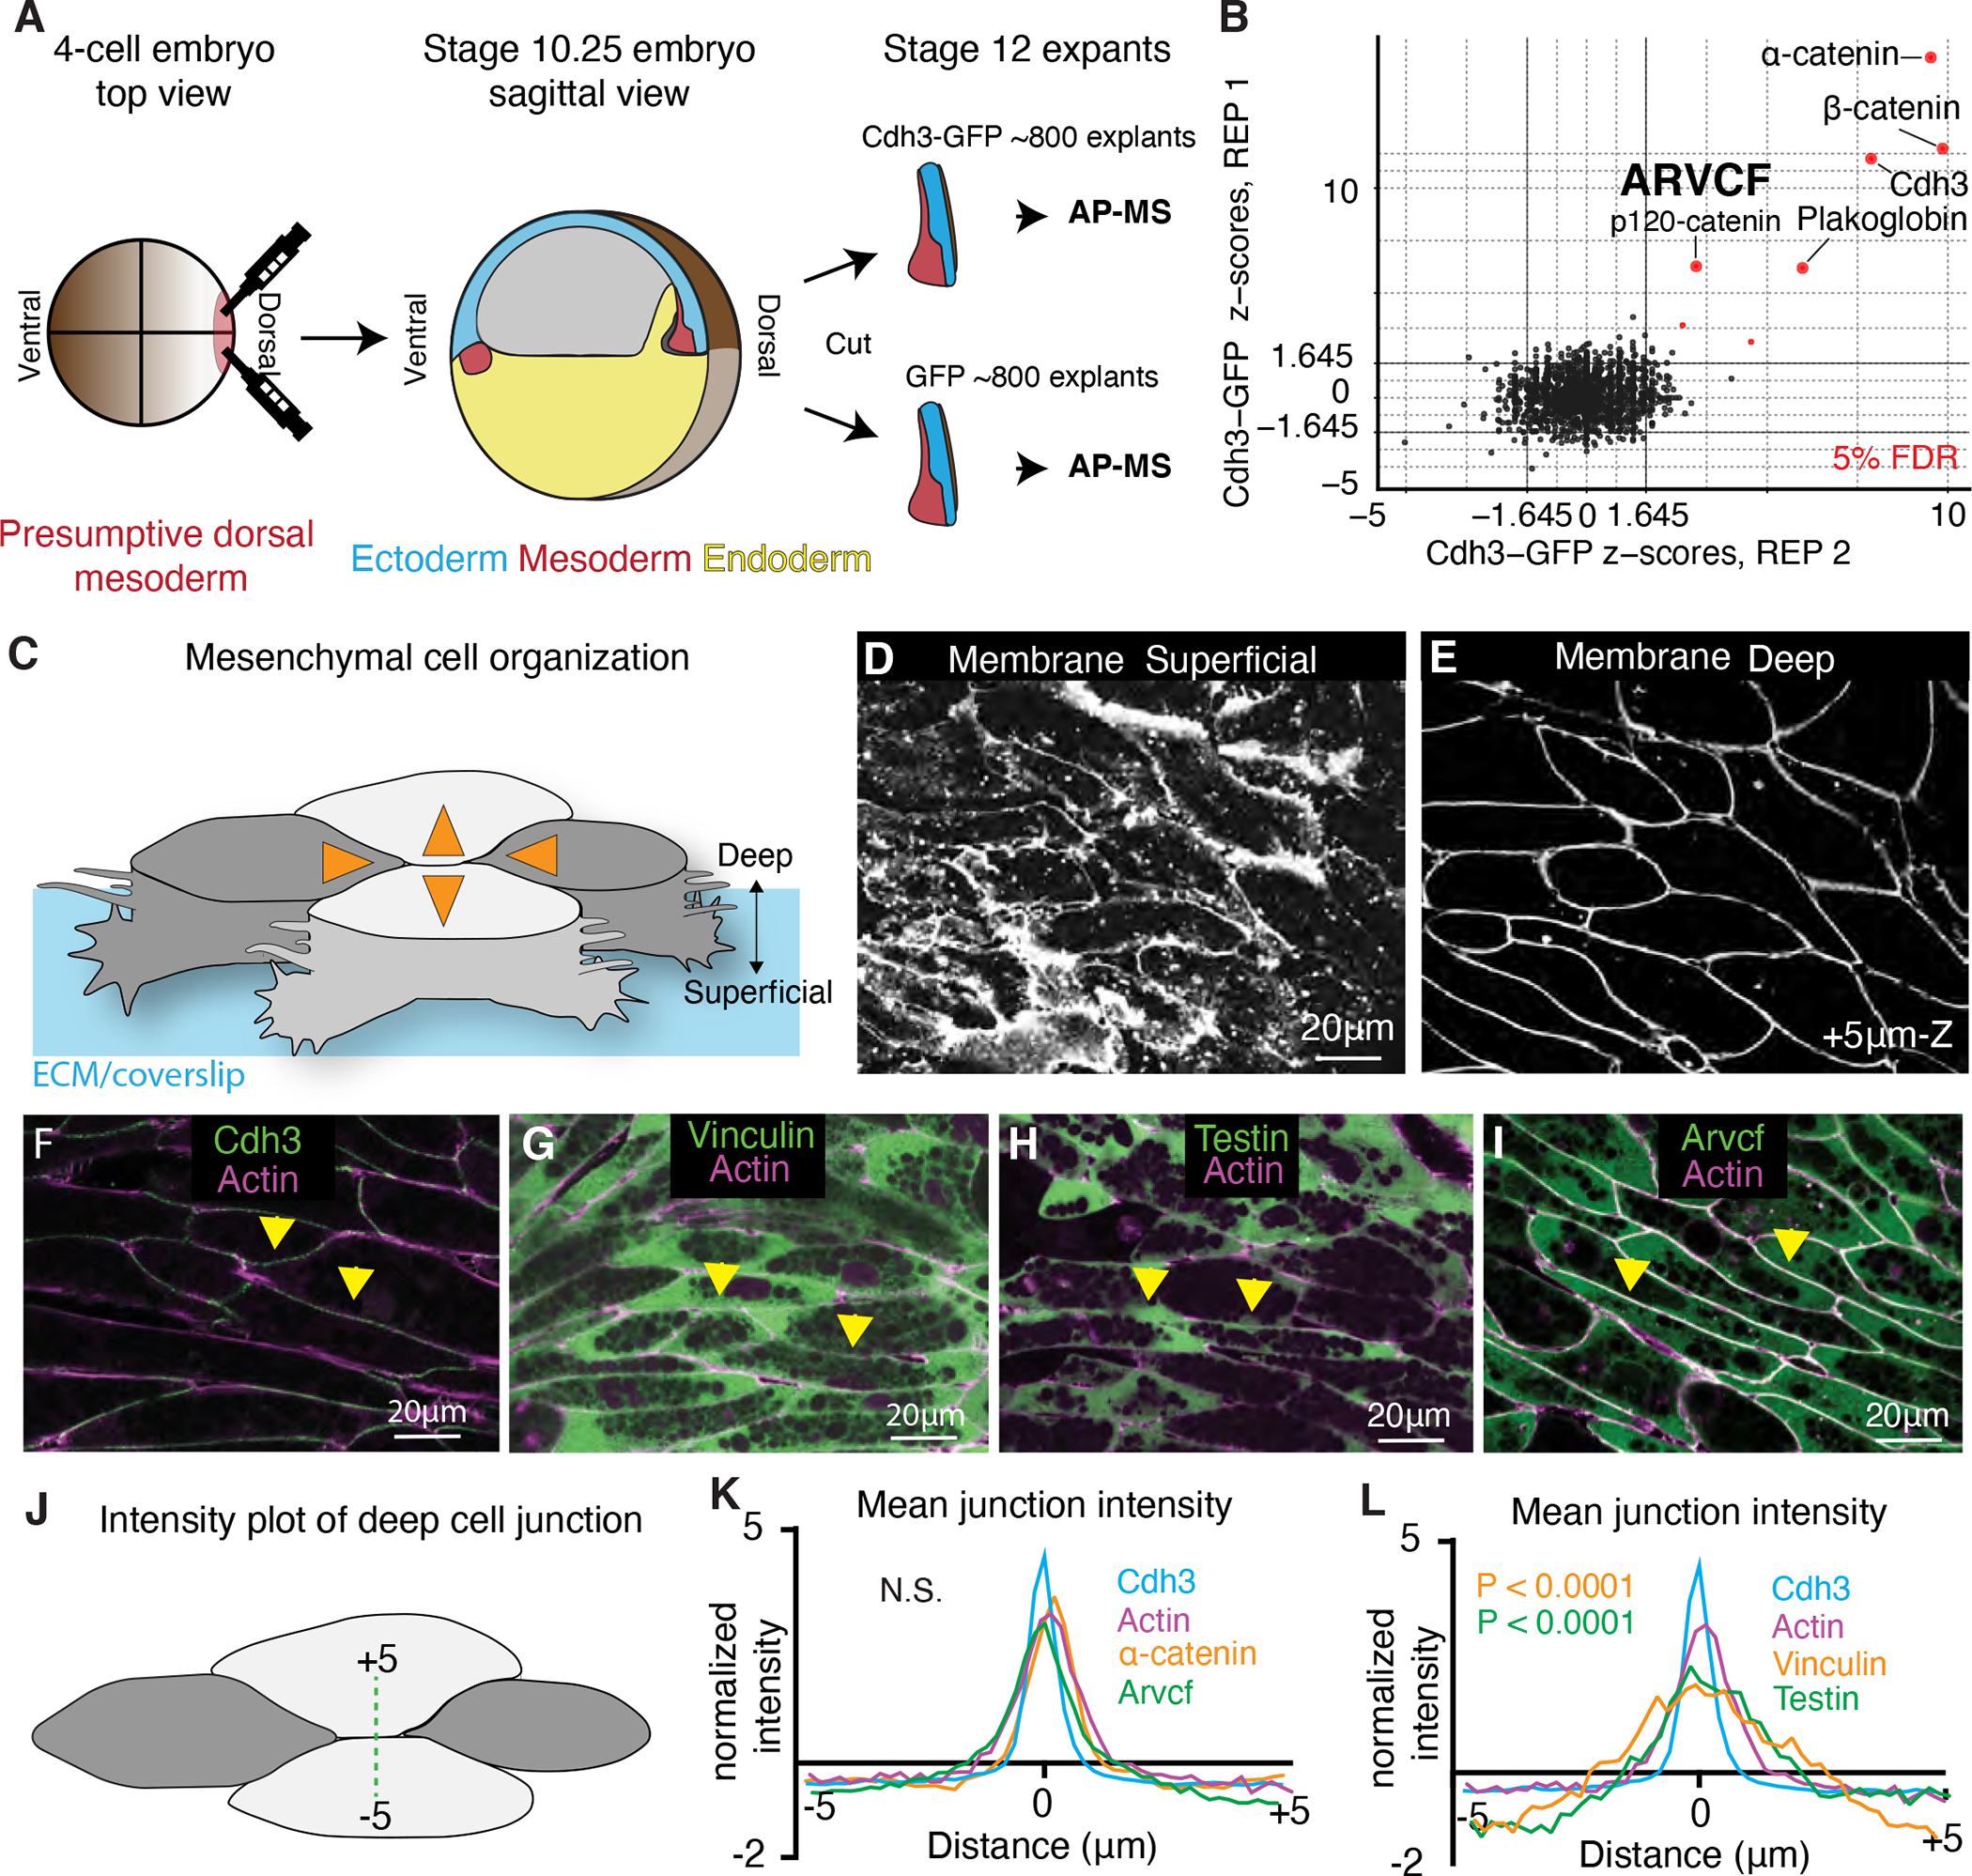
Figure 1: Tissue and stage-specific Cdh3 affinity purification mass spectrometry results in a highly specific Cdh3 protein interaction dataset.

A. Schematic depicting the method used for tissue and stage-specific affinity purification mass spectrometry (APMS) of Cdh3. B. Graph showing the relative protein orthogroup enrichment (see methods) from two replicates of the Cdh3 AP-MS experiment. Here we plot the z-scores from replicate 1 on the y-axis and the z-scores from replicate 2 on the x-axis. Each dot represents a protein identified in the Cdh3 AP-MS dataset and red dots represent proteins that fall below a 5% FDR threshold. C. Cartoon depicting Xenopus mesenchymal cells during convergent extension. Here the mediolateral cells, dark gray, move to each other resulting in displacement of the anterior-posterior cells, light gray. Orange arrows show the cell movements. Mesenchymal cells display apparent structural differences along the superficial (cell-ECM interface) to deep (cell-cell interface) axis. Here polarized lamellar-like structures are observed at the superficial surface. Movement deeper into the cell reveals cell-cell interfaces and actin-based protrusions which extend between neighboring cells. D. Image of the superficial surface of converging and extending Xenopus mesenchymal cells. Cells are labeled with a membrane marker which primarily shows lamellar-like protrusions at the cell-ECM interface. E. Image of the deep surface of the same cells shown in Fig. 1D. Here the membrane marker largely highlights the cell-cell junctions. F. Image of Cdh3 (green) and actin (magenta) at deep cell-cell contacts. Protein localization was visualized by expressing tagged fusion proteins. Yellow arrowheads point to cell junctions. G. Image of vinculin (green) and actin (magenta) at deep cell structures. Protein localization was visualized by expressing tagged fusion proteins. Yellow arrowheads point to cell junctions. H. Image of testin (green) and actin (magenta) at deep cell-cell junctions. Protein localization was visualized by expressing tagged fusion proteins. Yellow arrowheads point to cell junctions. I. Image of the Arvcf (green) and actin (magenta) at deep cell-cell junctions. Protein localization was visualized by expressing tagged fusion proteins. Yellow arrowheads point to cell junctions. J. Schematic displaying the method used to measure fluorescent intensities at cell-cell interfaces. K. Intensity plots of Cdh3 (blue), actin (magenta) α-catenin (orange), and Arvcf (green). Here zero is set at the center of the cell-cell junction and each protein shows a clear peak at the cell junction. Each line is the average over dozens of line plots from a minimum of three replicates. Distributions were statistically compared using a KS test. L. Intensity plots of Cdh3 (blue), actin (magenta), vinculin (orange), and testin (green) at cell-cell junctions. Vinculin and testin lack peaks at the cell-cell junction and the distributions of vinculin and testin were statistically different from Cdh3 and actin as compared by a KS test. Each line represents the average of dozens of line plots over a minimum of three replicates. See also figure S1 and figure S2.
