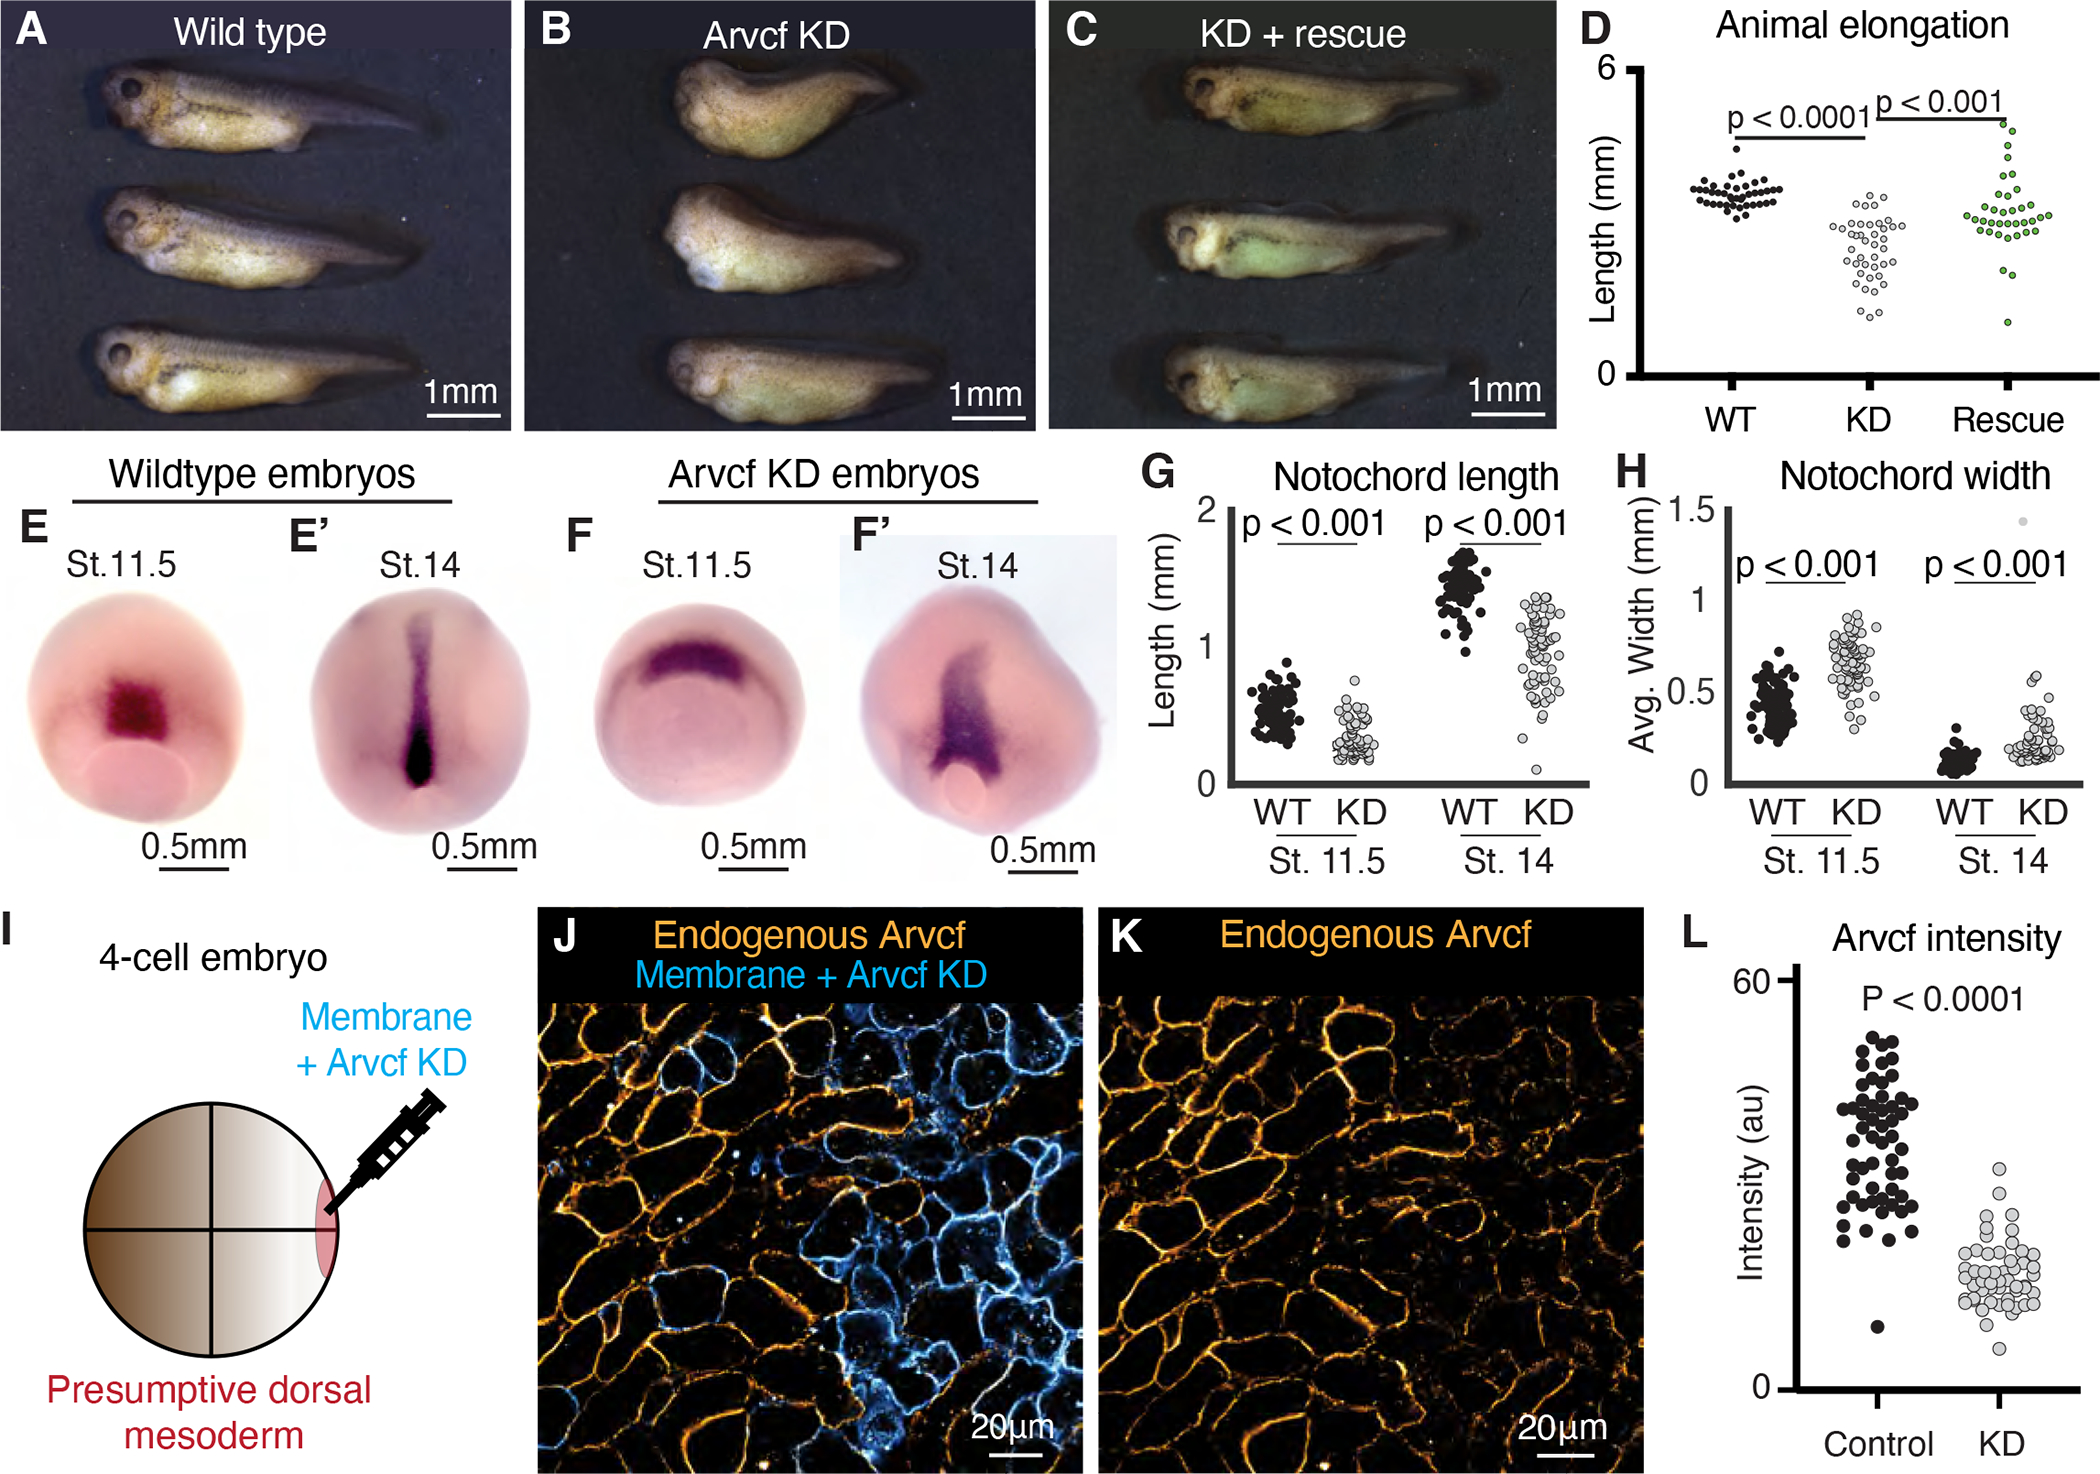
Figure 2: Arvcf is required for embryonic axis extension.

A. Wild type tadpoles (~st.40). B. Sibling embryos to those shown in Fig. 2A in which Arvcf was knocked down in the dorsal mesodermal cells. The Arvcf depleted embryos have a shortened head-to-tail axis and display a characteristic dorsal bend suggesting a CE defect. C. Sibling embryos in which Arvcf was knocked down and then rescued with exogenous expression of Arvcf-GFP. D. Plot showing tadpole (~st.40) head-to-tail length for the wildtype, ARVDF knockdown, and Arvcf rescue conditions. Embryo lengths were statistically compared using an ANOVA test. Each dot represents a single embryo and data was collected from a minimum of three experiments. E. Stage 11.5 wildtype embryos stained by in situ hybridization for the notochord probe Xnot. E’. Stage 14 wildtype embryos stained by in situ hybridization for the notochord probe Xnot. F. Stage 11.5 Arvcf knockdown embryos stained by in situ hybridization for the notochord probe Xnot. F’. Stage 14 Arvcf knockdown embryos stained by in situ hybridization for the notochord prob Xnot. G. Comparison of the total notochord length in wildtype or Arvcf knockdown embryos at stage 11.5 and stage 14. Conditions were statistically compared using a Mann-Whitney test. H. Comparison of the notochord width for wildtype or Arvcf knockdown embryos at stage 11.5 and stage 14. Conditions were statically compared using a Mann-Whitney test. I. Cartoon depicting the microinjection method used to generate mosaic animals. J. Immuno-staining for Arvcf (orange) in an embryo in which Arvcf has been mosaically knocked down (blue cells). K. The same image shown in Fig. 2J except the membrane marker has been removed to better visualize the Arvcf immunostaining. L. Quantification of endogenous Arvcf protein levels from the immunostaining performed on embryos with mosaic Arvcf knockdown. Each dot represents the average ARVCF intensity at the membrane of a single cell and data was collected from a minimum of three replicates. Conditions were statistically compared using a Mann-Whitney test.
