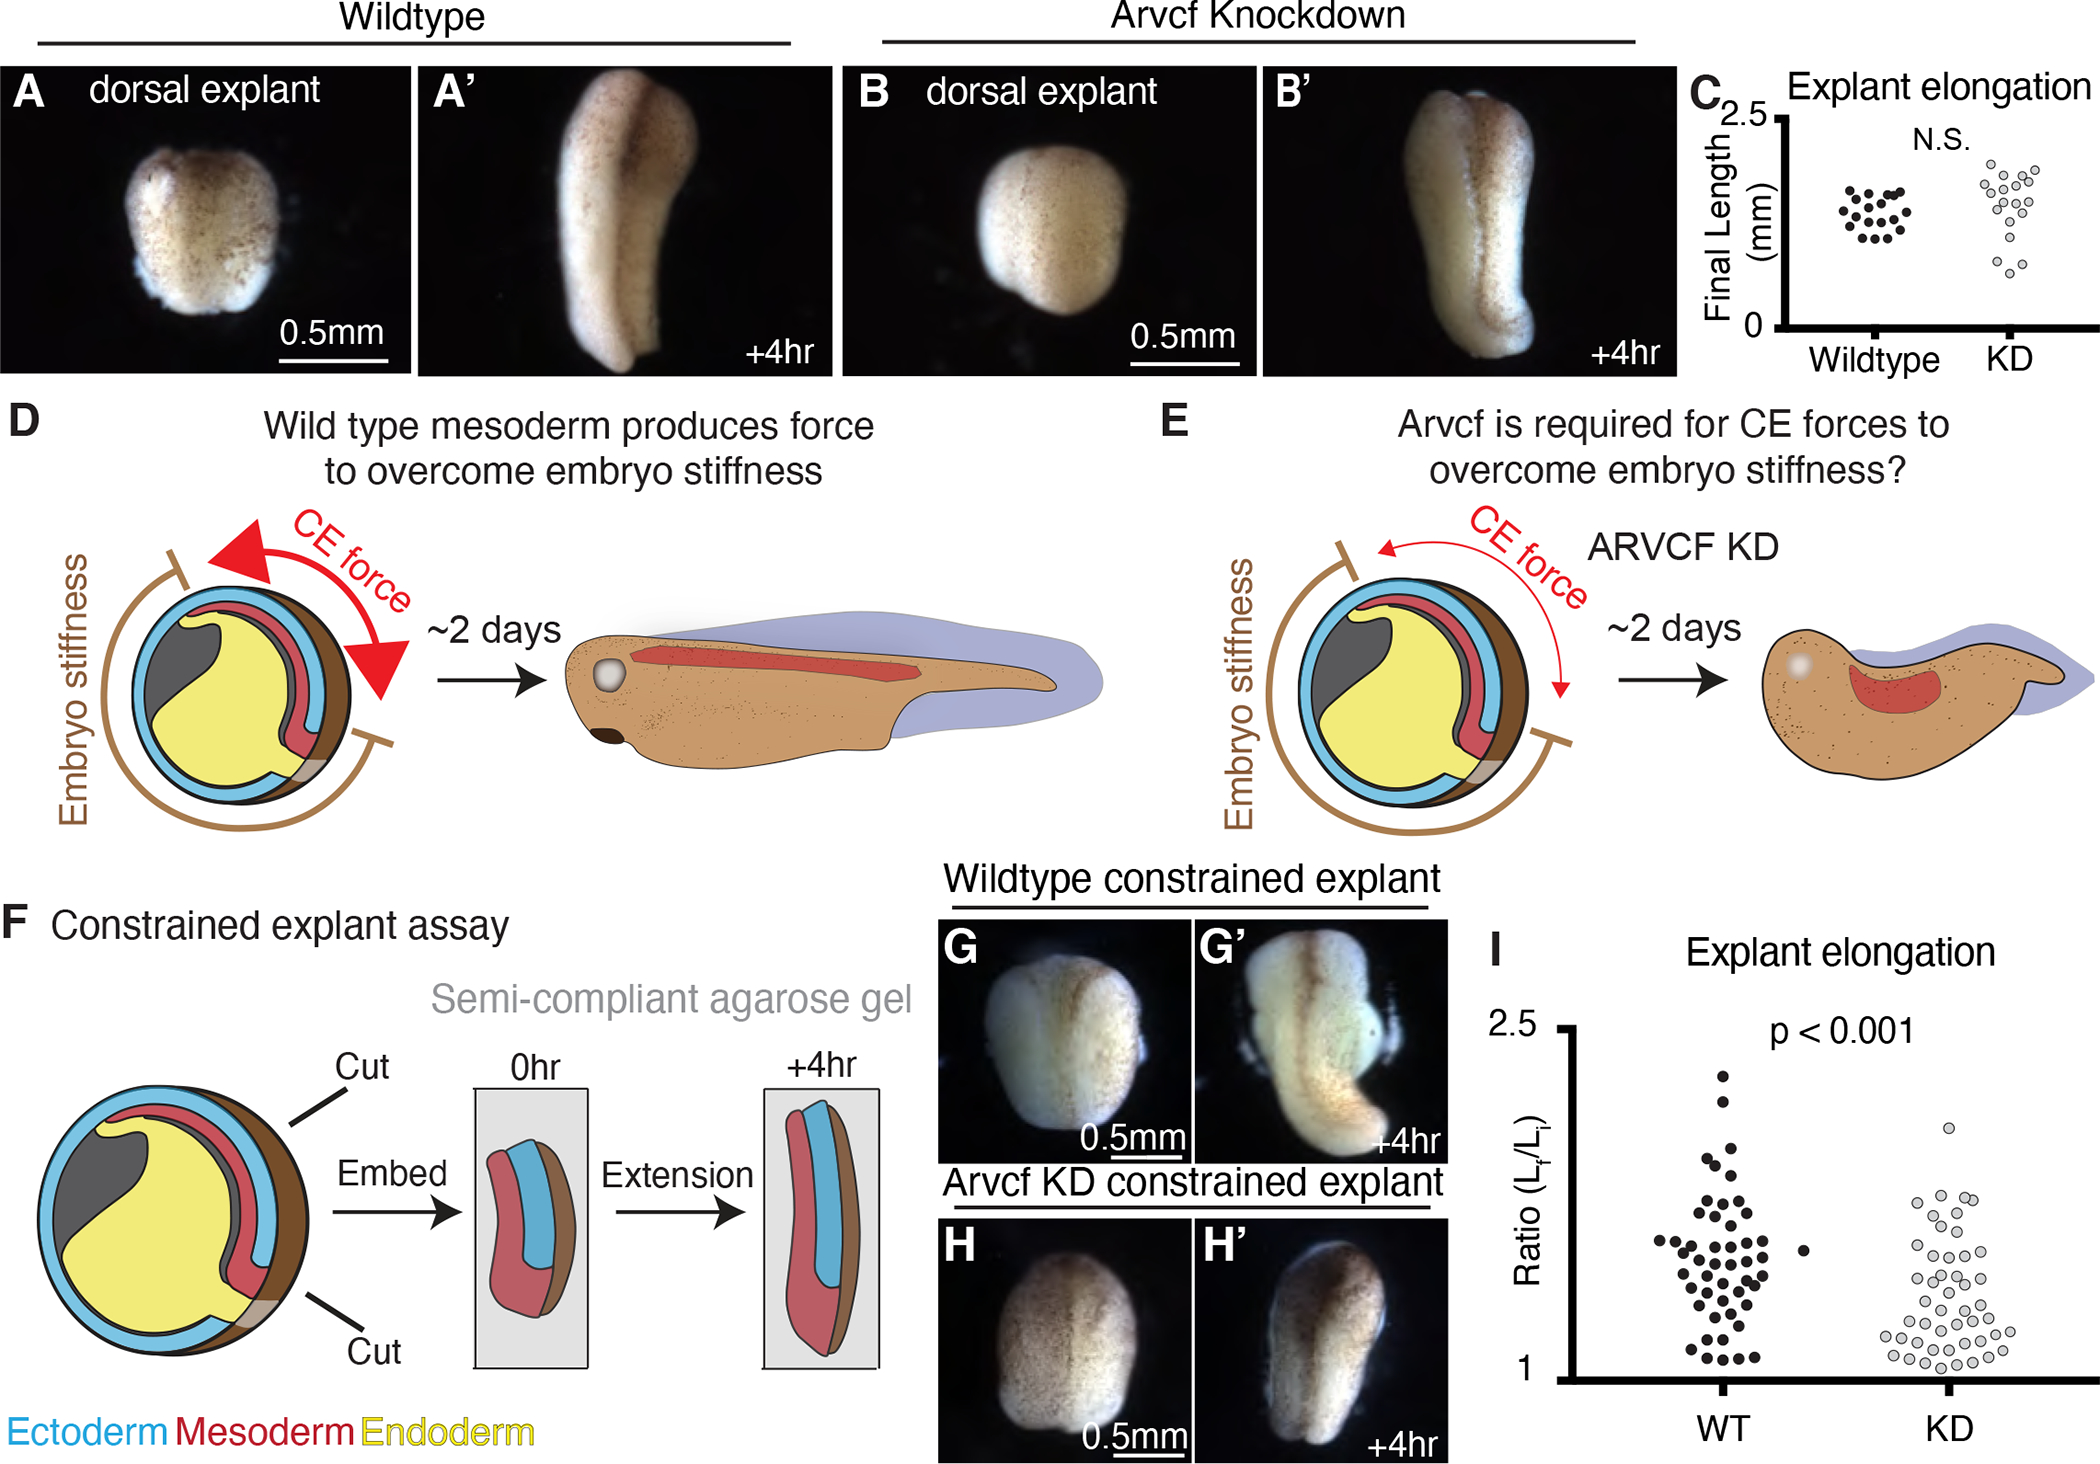
Figure 3: External constraint of Arvcf deficient explants recapitulates the embryonic axis extension defect.

A. Image of a wildtype dorsal isolate. A’. Image of a wildtype dorsal isolate after a four-hour period of extension. B. Image of a dorsal isolate in which Arvcf has been knocked down in the mesodermal cells. B’. Image of an Arvcf depleted dorsal isolate after a four-hour period of extension. C. Graph showing the final dorsal isolate length, after a four-hour elongation, for wildtype and Arvcf depleted embryos. Each dot represents the length of a single explant and conditions were statistically compared using a Mann-Whitney test. D. Cartoon depicting the forces involved in Xenopus axis extension. Here the dorsal mesoderm (red) and the overlaying neural ectoderm (blue, above red) converge and extend generating force to push against the stiff embryo. In the case of wildtype embryos, the CE generated force is sufficiently large (red arrows) to overcome the embryo stiffness and the resulting animals have elongated head-to-tail axis. E. We hypothesize that Arvcf is required for CE generated force and that depletion of Arvcf reduces the tissue level force produced by CE. In this case the reduced CE force is insufficient to push the stiff surrounding embryo and axis extension fails. F. Schematic depicting the constrained explant assay used to mimic the mechanical environment experienced within the embryo. G. Image of a dorsal isolate after embedding in gel. G’. Image of the same dorsal isolate shown in Fig. 3G after 4 hours of elongation. H. Image of an Arvcf deficient dorsal isolate after embedding. H’. Image of the same dorsal isolate in Fig. 3H after a 4-hour interval of extension. I. Graph showing the extent of dorsal isolate elongation during the constrained explant assay for wildtype and Arvcf knockdown dorsal isolates. The y-axis shows the ratio of the final explant length over the final explant length. Each dot represents a single dorsal isolate and conditions were statistically compared using a Mann-Whitney test. See also figure S3.
