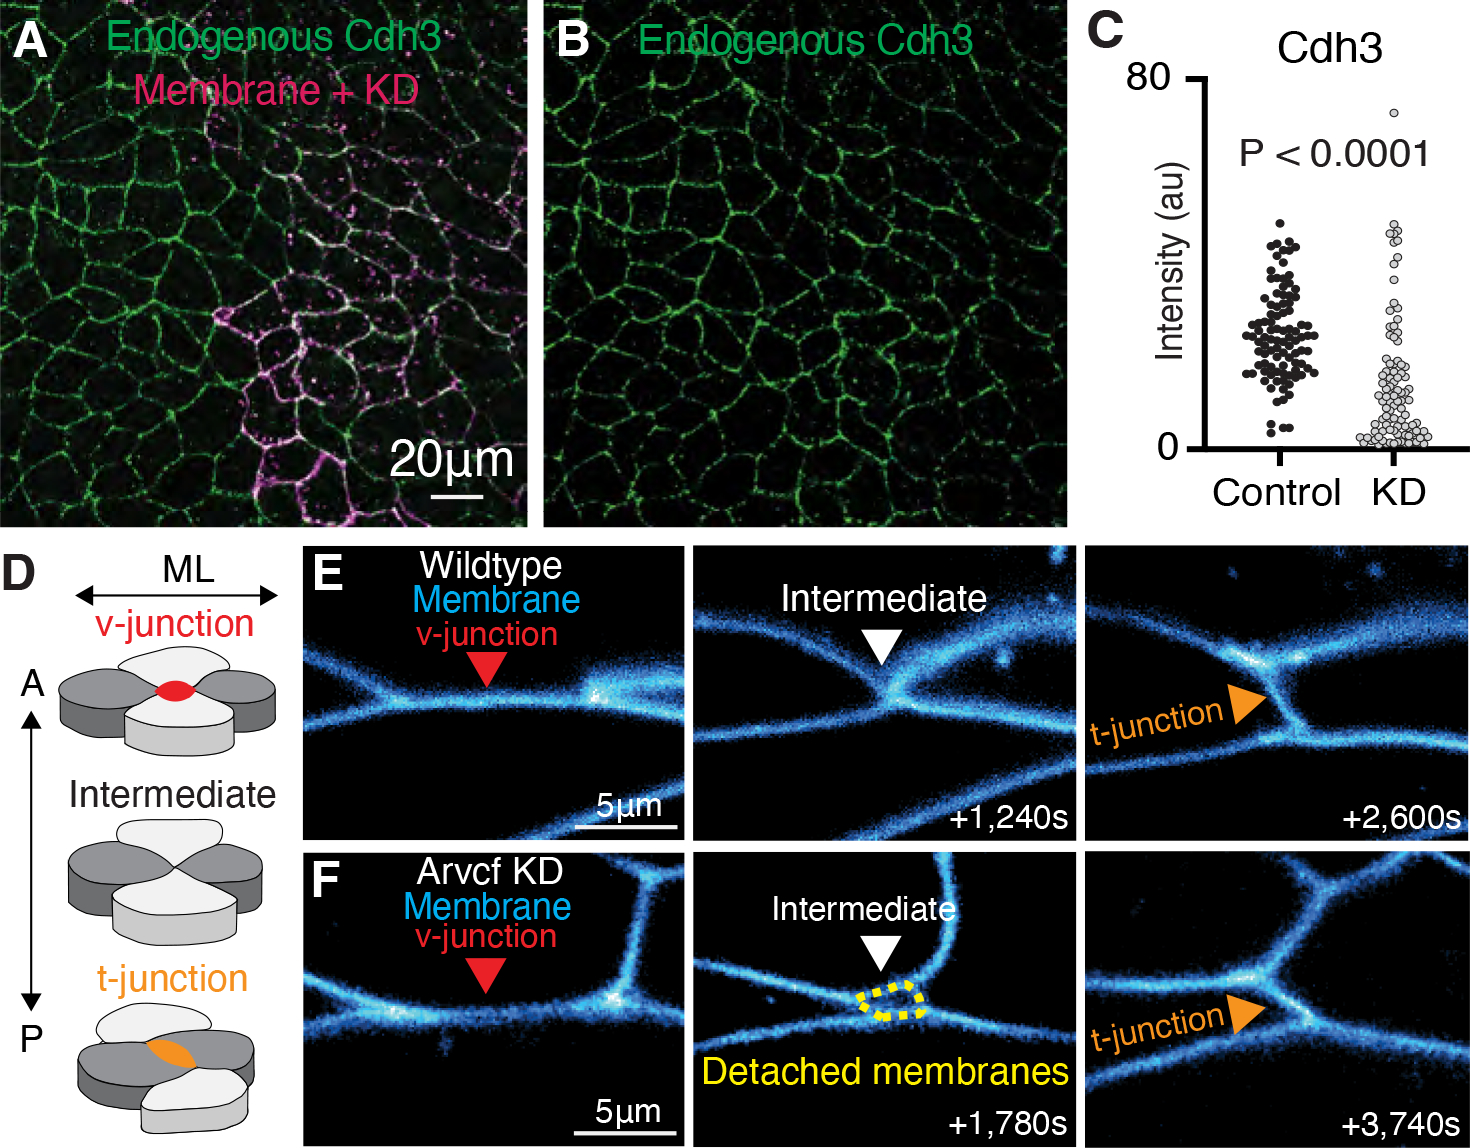
Figure 5: Arvcf KD reduces cell adhesion but only has a modest effect on cell intercalation.

A. Immunostaining for endogenous Cdh3 (green) in a field of cells where Arvcf had been mosaically knocked down. A membrane marker (magenta) was used as a tracer for the Arvcf morpholino. B. Image showing the isolated Cdh3 channel from Fig. 5A. C. Graph displaying the measurement of endogenous Cdh3 intensity from wildtype or Arvcf depleted cells. Each dot represents the average cdh3 intensity of a single cell and conditions were statistically compared using a Mann-Whitney test. D. Cartoon depiction of the cell movements that drive CE with emphasis on the cell-cell junctions. Initially there is a cell-cell junction between the anterior-posterior cells (light gray) termed a v-junction (red). The cells then intercalate bringing the mediolateral cells (dark gray) together. The mediolateral cells then form a new cell-cell contact (t-junction; orange) pushing the anterior posterior cells apart. E. Still frames from a time-lapse movie of wildtype cells intercalating. Cell membranes are labeled blue, and the cell intercalation can be visualized as the v-junction is replaced by a t-junction. F. Frames from a time-lapse movie showing one example of Arvcf depleted cells intercalating. Here we initially observe a v-junction which shortens, forms a 4-cell intermediate, which then resolves to form a new t-junction. One feature that was unique to the intercalation of the Arvcf depleted cells was that there were often gaps (yellow dashed lines) between the membranes at the intermediate state. Despite these gaps, cells were able to intercalate after ARVCF-KD.
