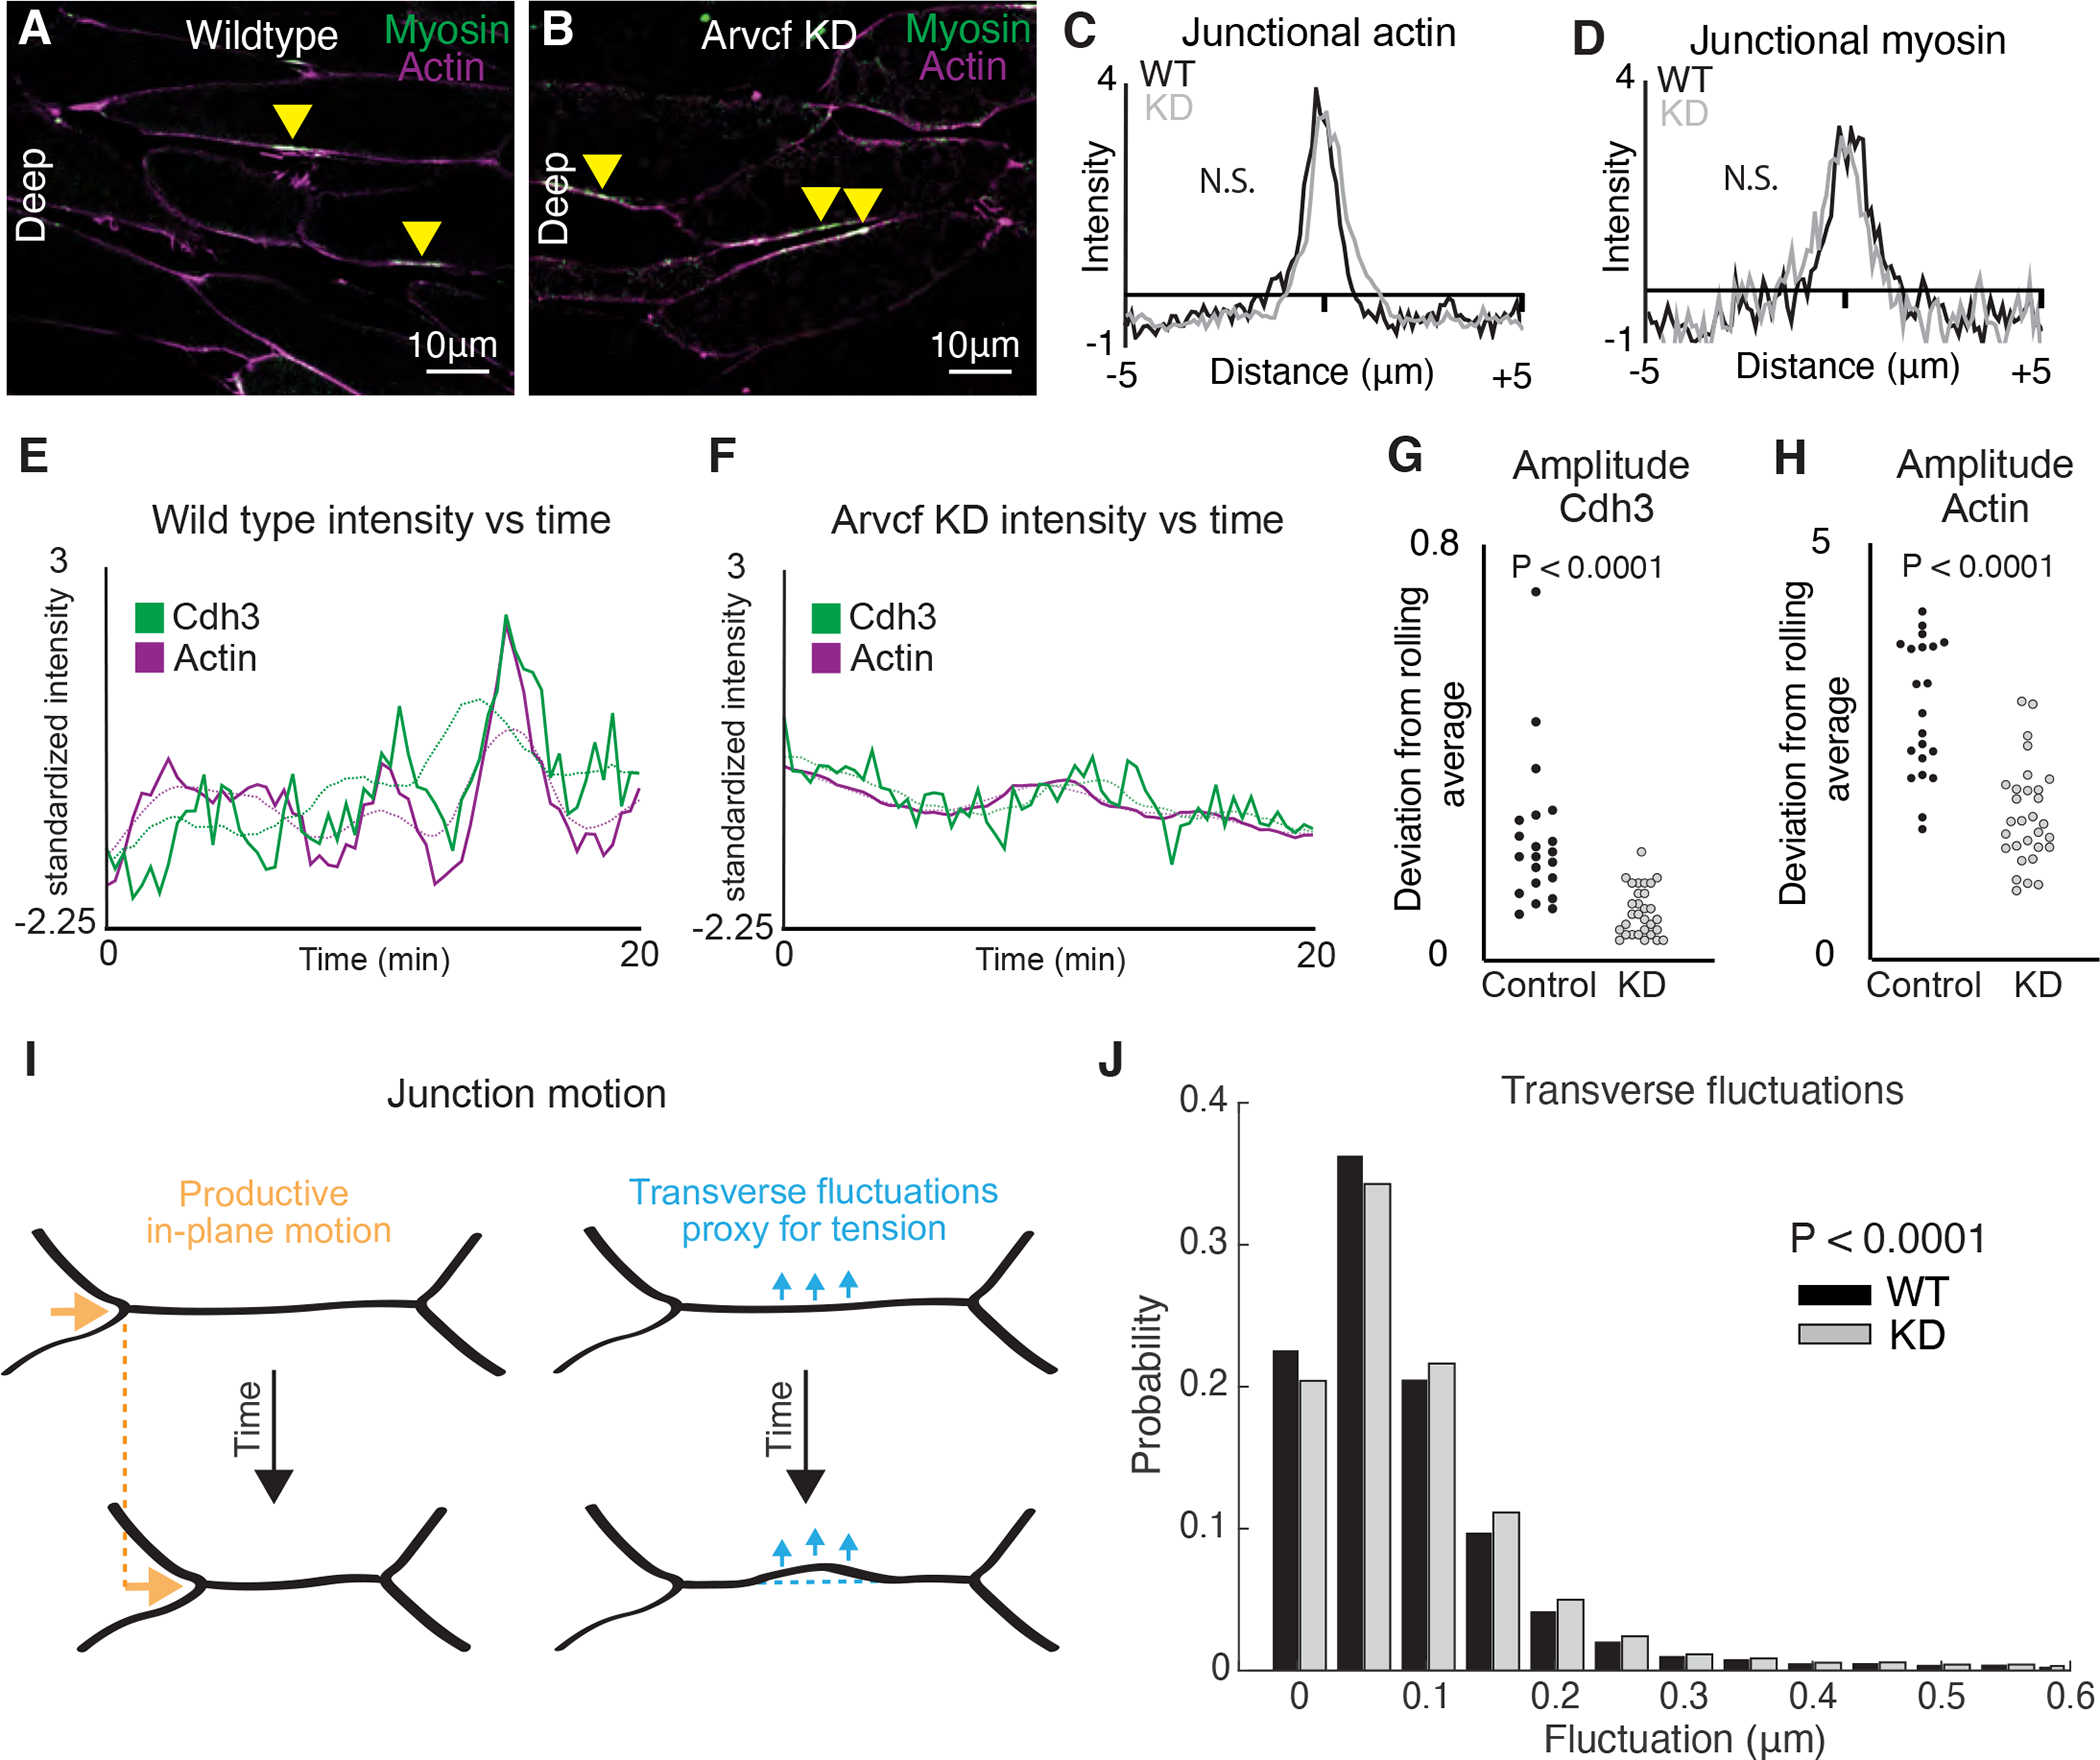
Figure 6: Depletion of Arvcf resulted in a dampening of the oscillatory temporal dynamics of Cdh3 and actin.

A. Image of deep cell-cell interfaces showing actin in magenta and myosin in green. Yellow arrowheads point to myosin accumulations at v-junctions. B. Image of deep cell-cell interfaces after Arvcf knockdown. Yellow arrows point to myosin enrichments at v-junctions. C. Intensity plots showing the mean intensity of actin at v-junctions. Wildtype is shown in black and Arvcf knockdown cells are shown in gray. Conditions were statistically compared using a KS test. D. Intensity plots showing mean intensity of myosin at deep v-junctions. Black shows wildtype and gray shows Arvcf depleted cells. Conditions were statistically compared using a KS test. E. Cdh3 (green) and actin (magenta) intensity plotted over time from a wildtype shortening v-junction. Dashed lines show the rolling average (over 3.33 min) for either Cdh3 or actin. F. Plot showing Cdh3 (green) and actin (magenta) intensity over time from an Arvcf depleted shortening v-junction. Dashed lines show the rolling average. G. We quantified the oscillation amplitude as the deviation of a protein’s intensity plot from that same protein’s rolling average. This graph shows the average Cdh3 amplitude for wildtype and Arvcf knockdown v-junctions. Each dot is the average amplitude from a single shortening v-junction. Conditions were compared using a Mann-Whitney test. H. The same quantification shown in Fig. 6J but looking at actin oscillation amplitude. Again, each dot represents the average amplitude at a single shortening v-junction and conditions were compared using a Mann-Whitney test. I. Schematic showing the transverse fluctuations which we use as a proxy for local junction tension. Orange shows the productive in-plane motion of junction shortening and blue shows the transverse fluctuations that are opposed to in-plane motion. Dashed lines represent the initial junction position. J. Quantification of the probability that a wildtype (black) or Arvcf knockdown (gray) junction will undergo a transverse fluctuation of a given size. The Arvcf knockdown junctions had significantly larger transverse fluctuations. Conditions were compared using a Mann-Whitney test.
