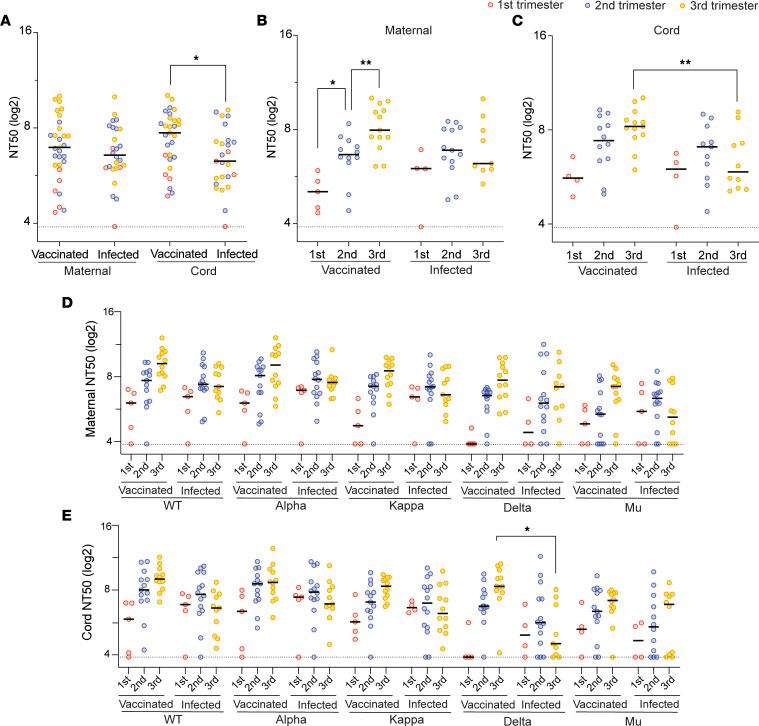
Figure 1. Neutralizing activity of maternal and cord plasma samples from the vaccination cohort and infection cohort.
(A) Comparison of the mean NT50 titers against all examined strains between the vaccinated (n = 30) and infected (n = 26) groups. The dot plots show mean NT50 values against variants of each patient in maternal plasma and cord plasma. Black bars represent the median of mean NT50 values. (B and C) Mean NT50 values of the maternal and cord blood were compared by 3 trimesters separately. The dot plots show mean NT50 values against all variants of each patient. Black bars represent the median of mean NT50 values. (D and E) Comparison of the NT50 values by trimester and by 5 strains in the maternal blood (D) and cord blood (E). The dot plots show NT50 values against each variant (vaccinated group: n = 30 for the WT strain and the Alpha, Kappa, Delta, and Mu variants; infected group: n = 30 for the WT strain and the Alpha and Kappa variants, n = 27 for the Delta variant, and n = 26 for the Mu variant). Black bars represent the median of NT50 values. The dotted lines indicate the cutoff threshold of this assay. Trimester of exposure is indicated by color (red, first trimester; blue, second trimester; yellow, third trimester). *P < 0.05; **P < 0.01; *** P < 0.001; ****P < 0.0001 by Mann-Whitney U test or Friedman’s test with Dunn’s multiple comparisons.

