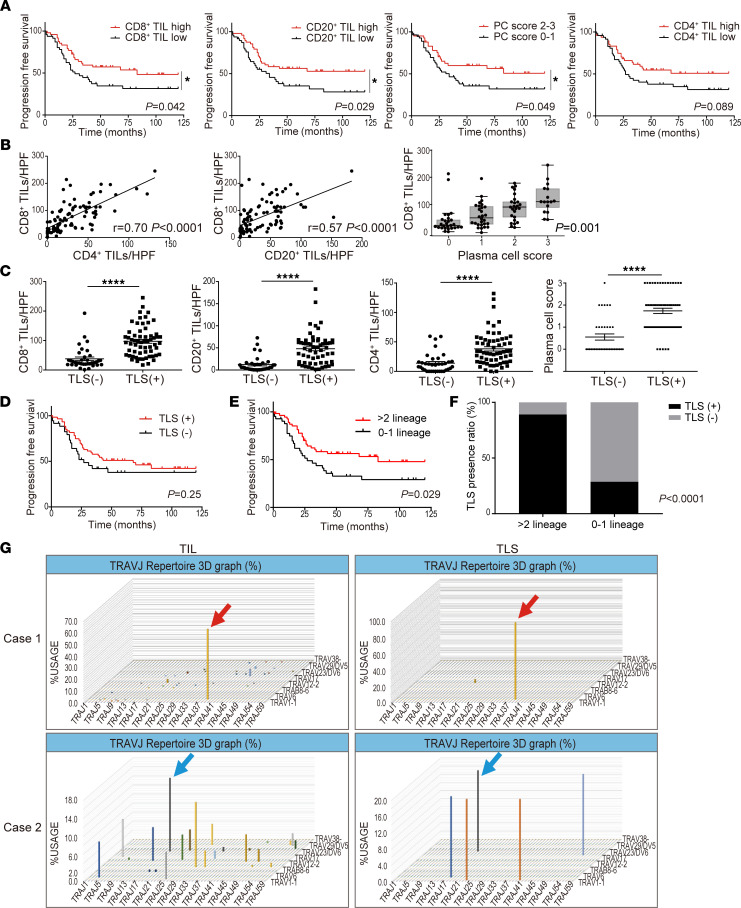
Figure 1. Intratumor infiltration of T cells and B cell lineages improves the prognosis of ovarian cancer and is associated with the presence of TLS.
(A) Progression-free survival of the cohort stratified by respective infiltration of T and B cell subsets (n = 97, each). (B) Association between infiltrated numbers of CD4+ T cells and CD8+ T cells, and CD8+ T cells and B cell lineage s in tumors (n = 97). Correlations were determined by Pearson’s correlation test and Jonckheere-Terpstratrend tests. The y axis represent the mean count of 5 HPFs. (C) Characterization of the immune infiltrate in tumors according to TLS presence (TLS−, n = 36; TLS+, n = 61). P values were determined by Mann-Whitney U test. (D) Progression-free survival of patients with HGSC related to the presence of TLS. (E) Progression-free survival based on lymphocyte infiltration pattern (>2 lineages, n = 55; 0–1 lineage, n = 42). Analyses were performed with Kaplan-Meier estimates and log-rank tests in A, D, and E. (F) TLS presence ratio based on lymphocyte infiltration patterns. Analysis was performed by Fisher’s exact test. (G) TCR repertoire analysis separating TLS and TIL regions. The horizontal axis represents the J gene, the depth represents the V gene, and the vertical axis represents the frequency of usage. Clones indicated by arrows of the same color confirm the same amino acid sequence of CDR3.

