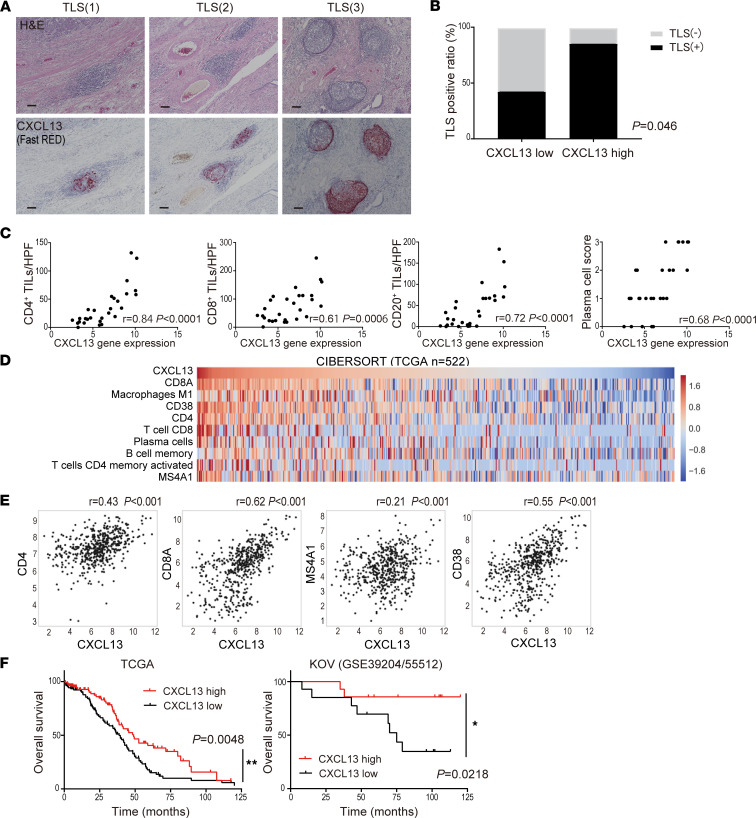
Figure 2. CXCL13 gene expression in tumors is significantly correlated with the presence of TLS, lymphocyte infiltration, and a favorable prognosis for ovarian cancer.
(A) Representative TLS in tissues stained by H&E and CXCL13 (Fast RED) by RNA ISH. Scale bars: 100 μm. (B) TLS presence ratio based on CXCL13 gene expression. Analysis by Fisher’s exact test in 28 cases with microarray data. (C) Characterization of the immune infiltrate in tumors according to CXCL13 gene expression (n = 28). Correlation was determined by Spearman’s correlation test. (D) The distribution of infiltrating immune cells into the tumor site and CXCL13 gene expression using CIBERSORT (n = 522). (E) Correlation of CXCL13 gene expression with CD4, CD8A, MS4A1, and CD38 in CIBERSORT. Correlation was determined by Spearman’s correlation test. (F) Overall survival of patients with HGSC by CXCL13 gene expression (TCGA, n = 217; KOV, n = 28). Patients with CXCL13hi defined if CXCL13 gene expression was above the median. Analyses were performed with Kaplan-Meier estimates and log-rank tests. The level of significance was set as *P < 0.05 and **P < 0.01.

