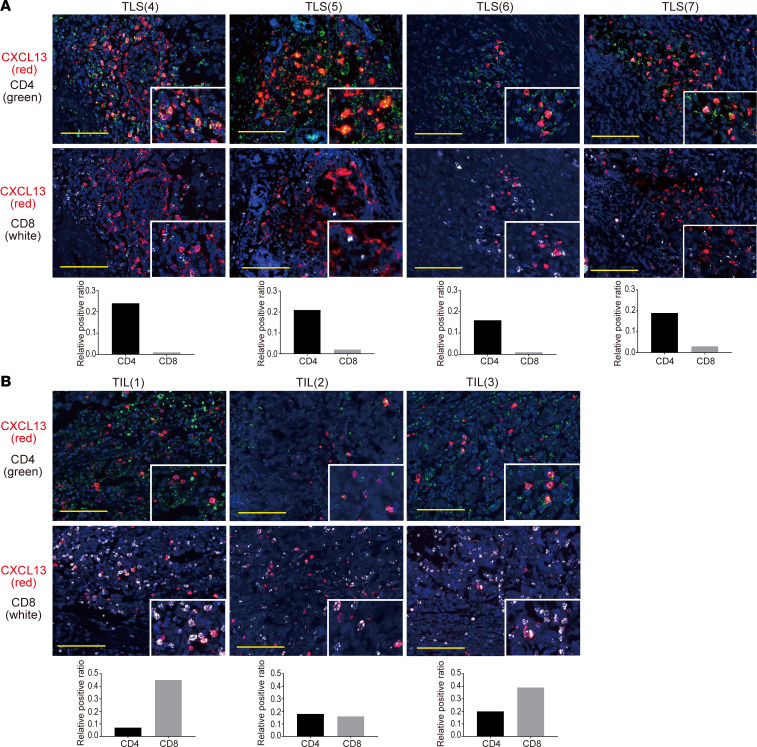
Figure 3. CXCL13 is mainly produced by CD4+ T cells in TLS.
(A) Fluorescent double staining of CXCL13 (red) and CD4 (green), and CXCL13 (red) and CD8 (white) by RNA ISH in TLS. Images of 4 representative TLS are shown. (B) Fluorescent double staining of CXCL13 (red) and CD4 (green), and CXCL13 (red) and CD8 (white) by RNA ISH in TIL. The upper and lower pictures are representative TIL images from the same patient. Nuclei are stained with DAPI (blue). Scale bars: 100 μm. Colocalization of CXCL13 with CD4 or CD8 is shown in the bar graph as the relative positive ratio quantified using BZ-H4C/hybrid cell count software.

