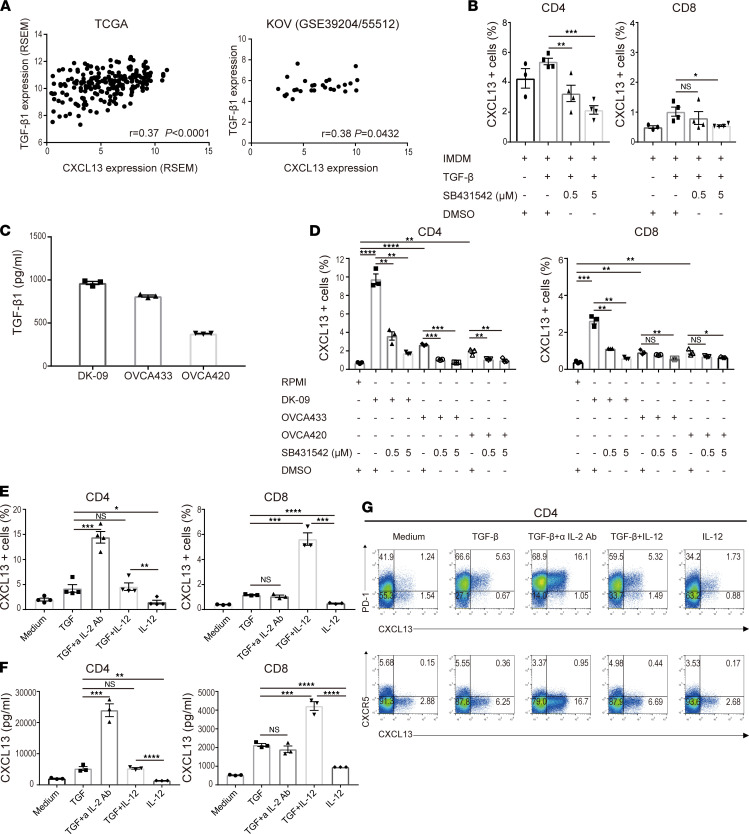
Figure 5. TGF-β promotes the production of CXCL13.
(A) Correlation between CXCL13 and TGF-β1 expression in TCGA (n = 217) and KOV (n = 28). Correlation was determined by Spearman’s correlation test. (B) Human naive CD4+ and CD8+ T cells from a healthy donor were differentiated by TCR stimulation and TGF-β1 in the presence or absence of a TGF signal inhibitor, SB431542. The proportion of CXCL13+ cells was determined by flow cytometry. Data are shown as the mean ± SEM (n = 3–4). Statistical significance was determined by 2-tailed Student’s t test. *P < 0.05, **P < 0.01, and ***P < 0.001. (C) The concentration of TGF-β1 in conditioned medium obtained from 3 human ovarian cancer cell lines was measured by ELISA. Data are shown as the mean ± SEM (n = 3). (D) Human naive CD4+ and CD8+ T cells from a healthy donor were differentiated with TCR stimulation and conditioned medium obtained from 3 human ovarian cancer cell lines in the presence or absence of a TGF signal inhibitor, SB431542. The proportion of CXCL13+ cells was determined by flow cytometry. Data are shown as the mean ± SEM (n = 3). (E–G) Human naive CD4+ and CD8+ T cells from a healthy donor were differentiated with TCR stimulation and the indicated cytokines. The proportion of CXCL13+ cells was determined by flow cytometry (E). The concentration of CXCL13 in the culture supernatant was measured by ELISA (F). Data are shown as the mean ± SEM (n = 3–4). Statistical significance was determined by 2-tailed Student’s t test. *P < 0.05, **P < 0.01, ***P < 0.001, ****P < 0.0001. Representative dot plots of PD-1 (upper row), CXCR5 (lower row), and intracellular CXCL13 in healthy human naive CD4+ T cells are shown (G).

