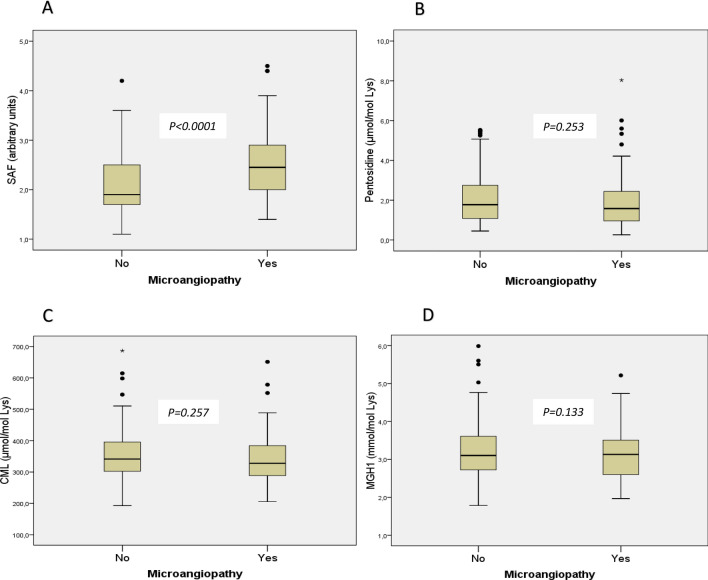
Fig. 3.
Comparison of tissue (evaluated by SAF) and circulating (i.e., CML, pentosidine, MGH1) AGEs between patients with microangiopathy and those without microangiopathy. Data are presented in box plots comparing patients with microangiopathy and those without microangiopathy. Skin autofluorescence (SAF), which reflects the tissue content of advanced glycation end-products, is represented in box plot A and circulating AGE are represented in box plots B for pentosidine, C for carboxymethyllisine, and D for methylglyoxal, respectively

