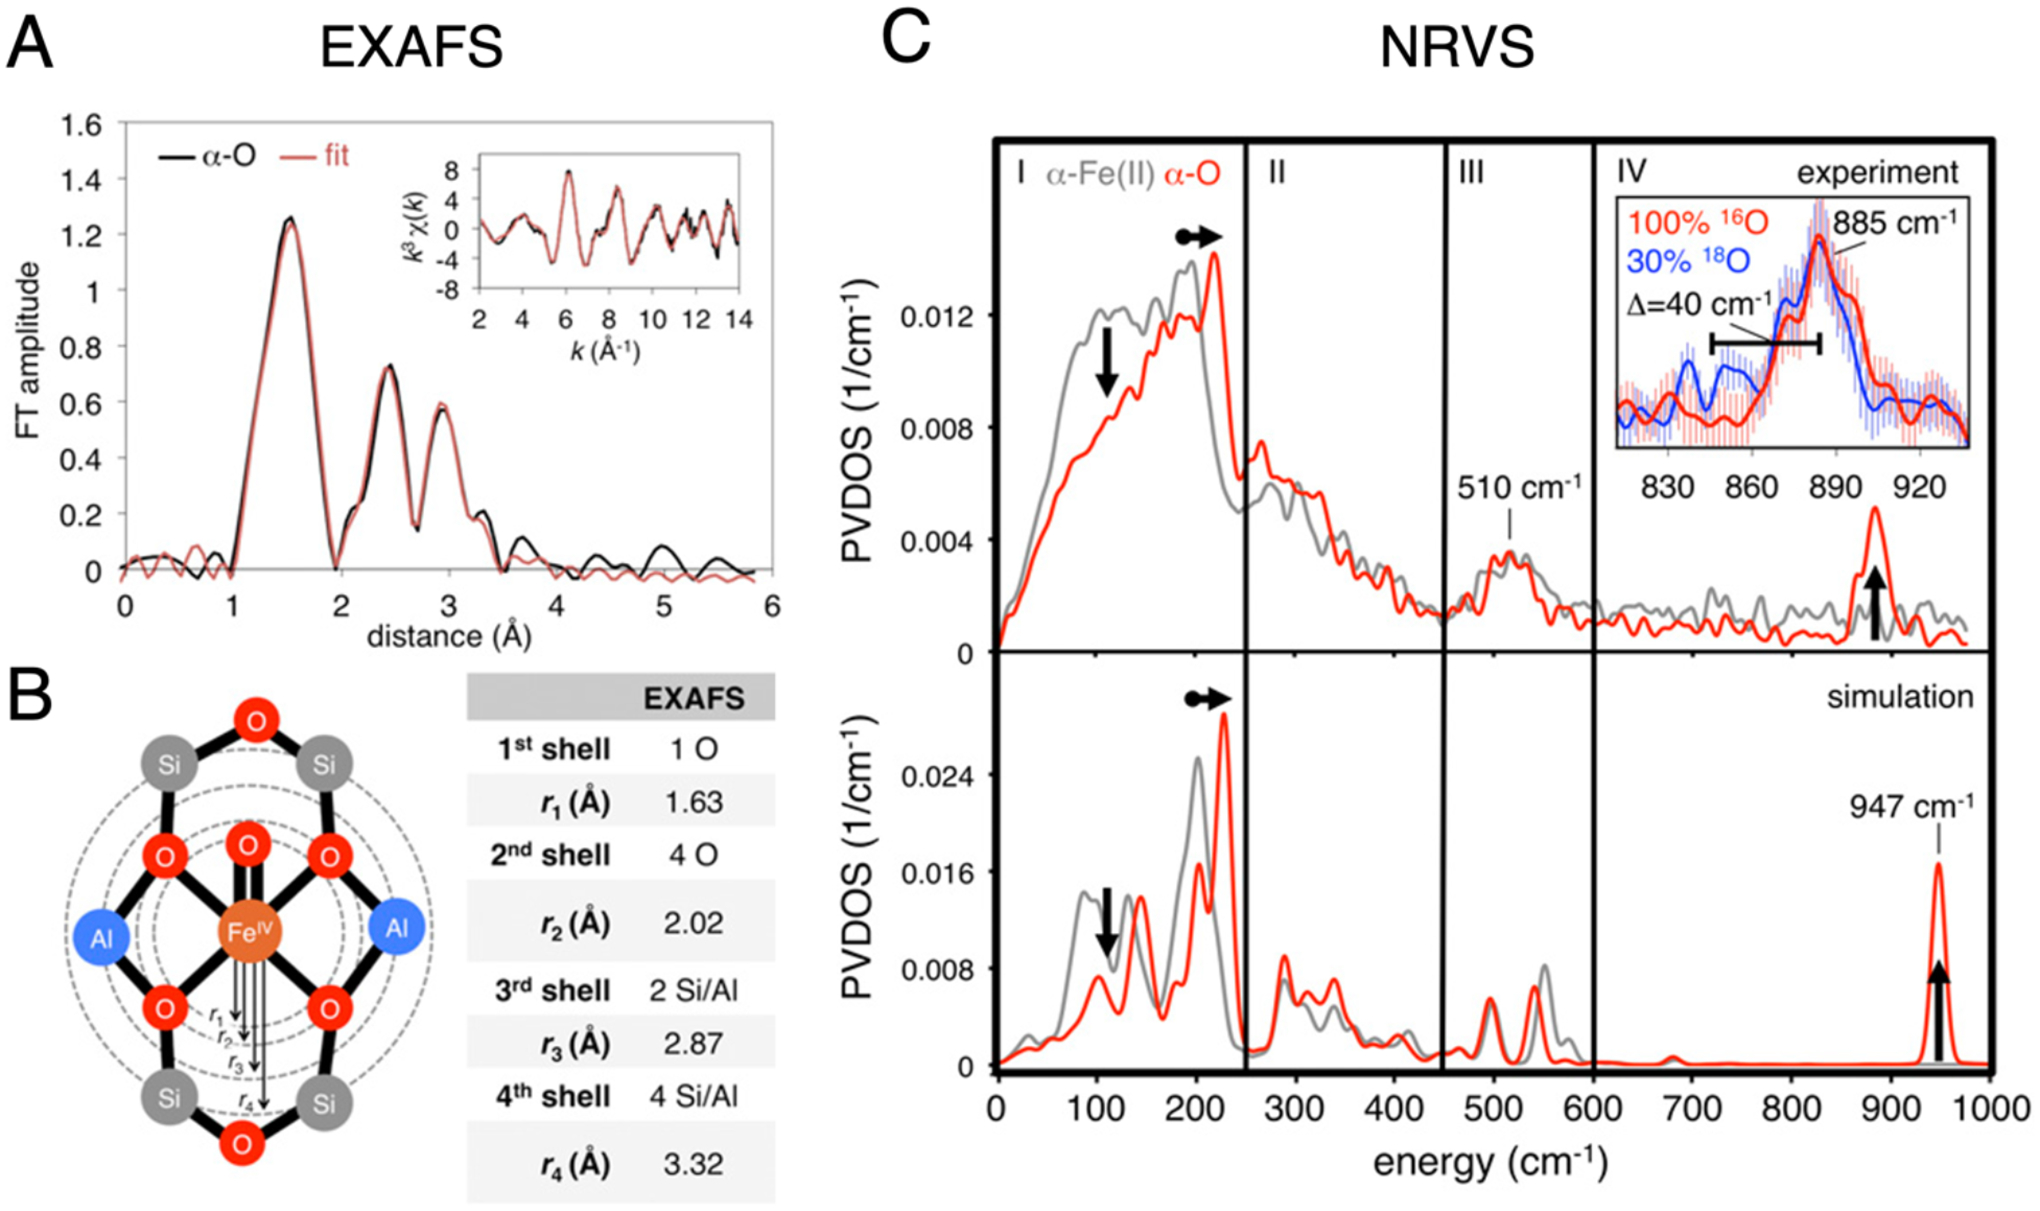
Figure 27.

(A) FT-EXAFS spectrum of α-O (black), with fit in red. Parameters of the EXAFS fit are shown in (B). (C) Experimental NRVS spectra of α-Fe(II) (top, gray trace) and α-O (top, red trace). The 885 cm−1 Fe(IV)=O stretching mode is shown in the inset in region IV, including data from18O isotopic perturbation. NRVS spectra simulated from DFT models of α-Fe(II) and α-O are shown in the bottom panel. Adapted from ref 59. Copyright 2018 National Academy of Sciences.
