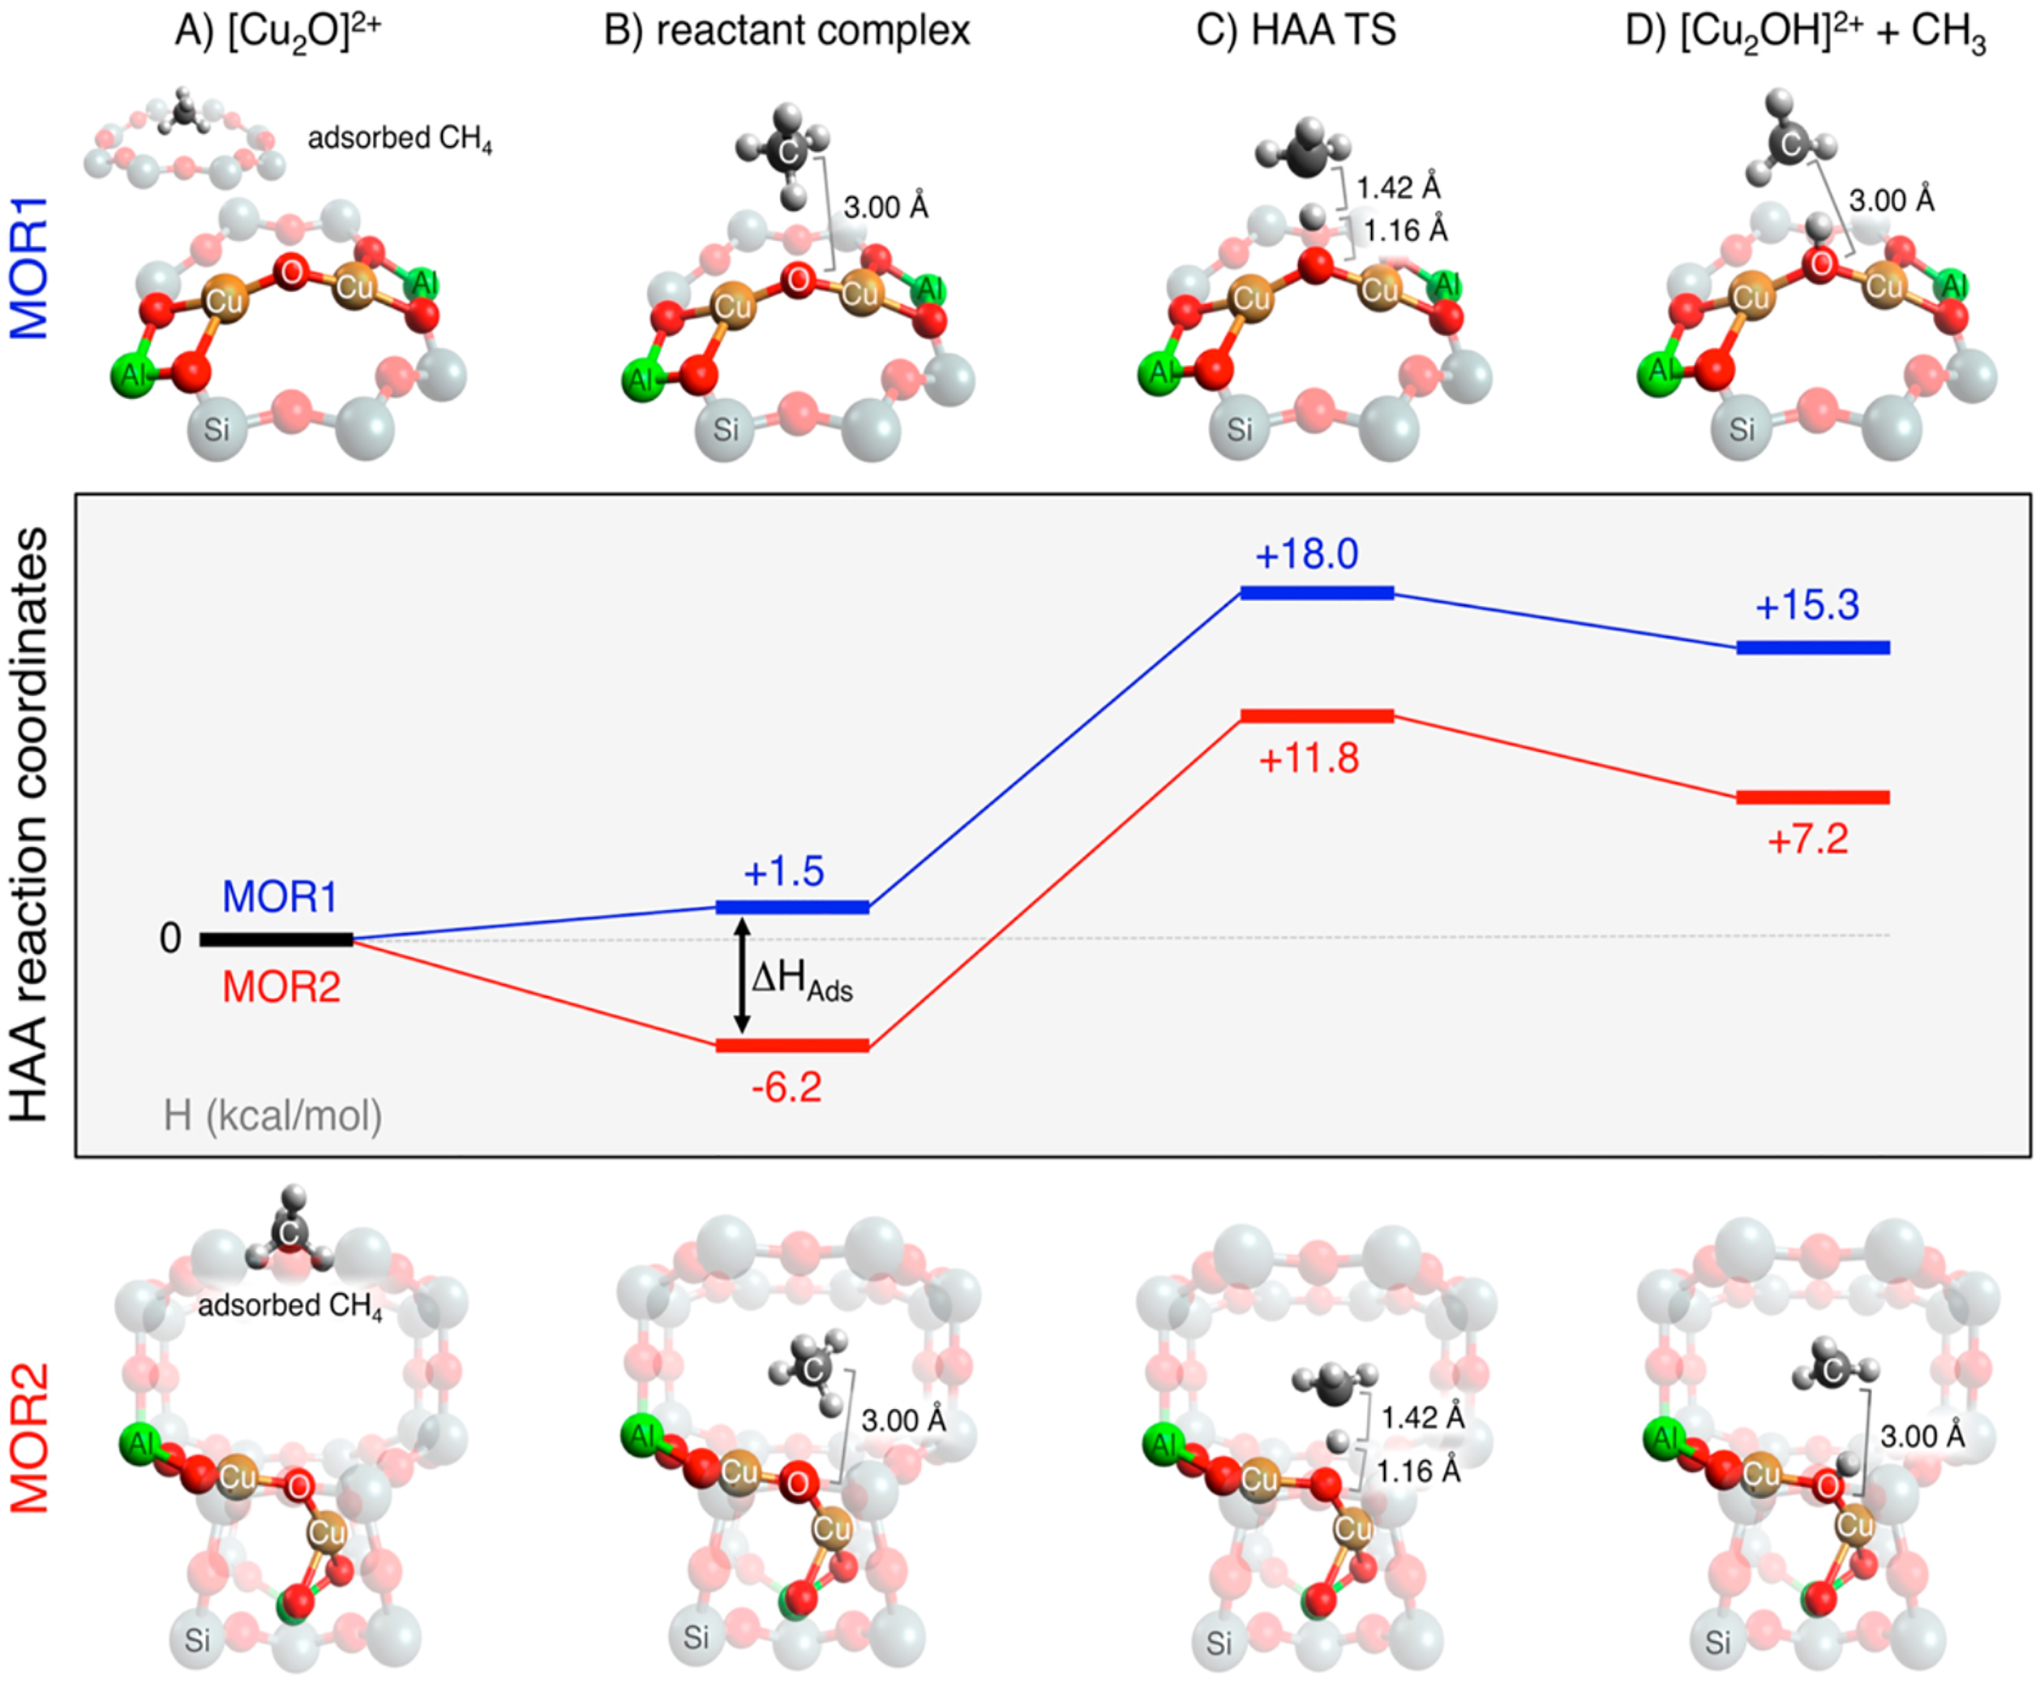
Figure 36.

DFT evaluation of the CH4 HAA reaction coordinates for MOR-1 (top structures, blue path) and MOR-2 (bottom structures, red path), illustrating how van der Waals contact between the substrate and the zeolite lattice lowers the apparent activation barrier for MOR-2 (but not MOR-1). (Color legend: orange: Cu; red: O; green: Al; grey: C; and white: H.) Reproduced from ref 31. Copyright 2018 American Chemical Society
