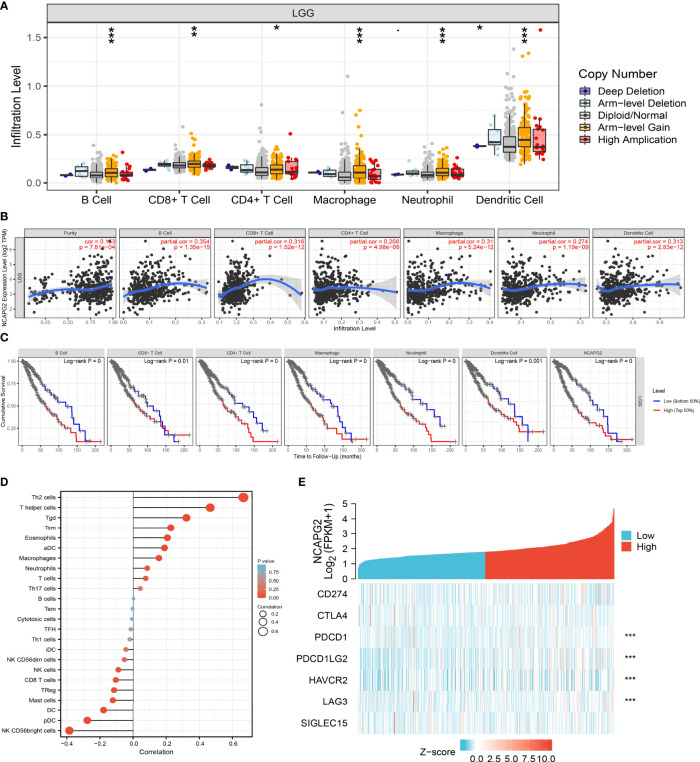
Figure 10.
Analysis of the correlation between NCAPG2 expression and diverse immune cell infiltration. (A) The correlation between NCAPG2 expression and somatic copy number alterations examine by TIMER. (B) The correlation between NCAPG2 expression and the infiltration levels of B cells, CD4+ T cells, CD8+ T cells, dendritic cells, Macrophages and Neutrophils. (C) The B cells, CD4+ T cells, CD8+ T cells, dendritic cells, Macrophages and Neutrophils are correlated with the cumulative survival rate in LGG examine by TIMER. (D) The correlation between NCAPG2 expression and 24 type immune cell infiltration. (E) The correlation between the NCAPG2 expression and various immune checkpoints related genes. P < 0.05 (*), P < 0.01 (**) and P < 0.001 (***).

