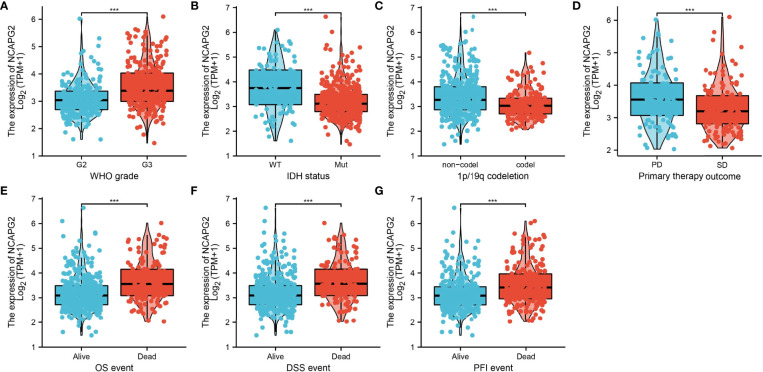
Figure 2.
The correlation between NCAPG2 expression and clinical information in LGG. (A–G) The correlation between NCAPG2 expression and clinical features, including the higher tumor grades, IDH mutation status, 1p/19q chromosome co-deletion, primary therapy outcome, OS event, DSS event, and PFS event. P < 0.001 (***).

