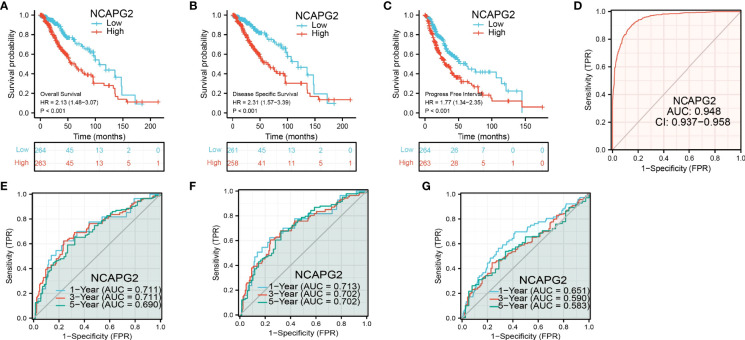
Figure 3.
Prognostic and diagnostic value of NCAPG2 (A-C) Kaplan–Meier survival curves showed that LGG patients with high NCAPG2 expression exhibited poor overall survival, disease-specific survival and progression-free survival of NCAPG2 in LGG determined by TCGA-LUAD dataset. (D-G) Time-dependent ROC curves were used to determine the diagnostic value of NCAPG2 in LGG.

