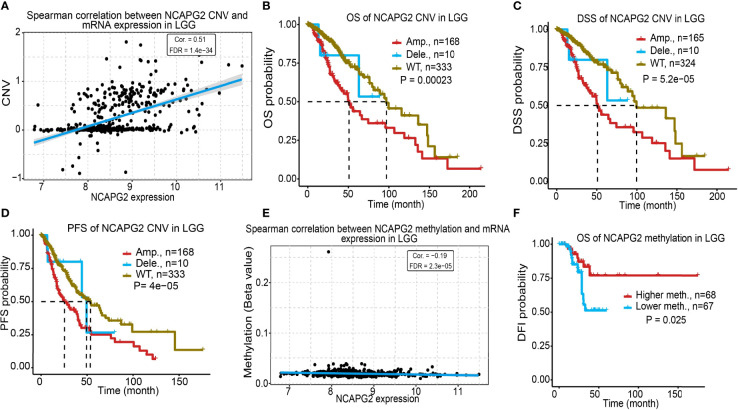
Figure 7.
Analysis of correlation between CNV, DNA methylation and NCAPG2 expression in LGG. (A) Analysis of correlation between CNV and NCAPG2 expression in LGG. (B–D) CNV of NCAPG2 was significantly correlated to OS, DSS and PFS in LGG. (E) Analysis of correlation between DNA methylation and NCAPG2 expression in LGG. (F) DNA methylation of NCAPG2 was significantly correlated to OS in LGG.

