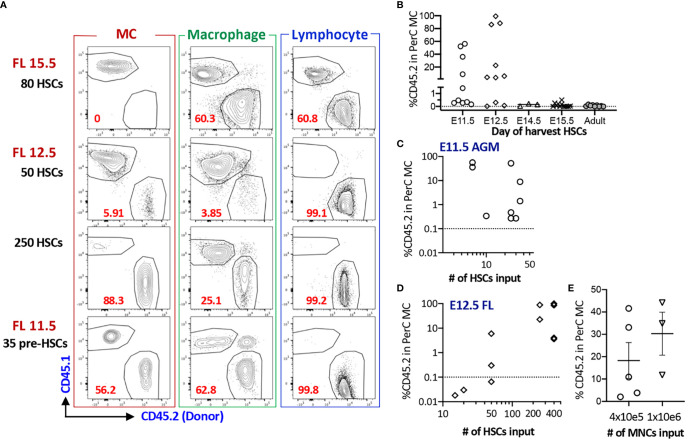
Figure 2.
AGM pre-HSC and FL HSC at E12.5 possess MC repopulating capacity, but not after E14.5. (A) Representative flow plots of MC, macrophage, and lymphoid reconstitutions from 15.5 FL, 12.5 FL HSC or E11.5 AGM pre-HSCs in PerC (gating strategy provided in S1B). (B) % Donor (CD45.2) contributions of MCs in PerC based on donor ages. (n=32 for 11.5, n=27 for E12.5, n=4 for E14.5, n=11 for E15.5, n=9 for adult BM). (C, D) Numbers of HSC transplanted and % donor (CD45.2) in the total host PerC MCs are shown for E11.5 AGM pre-HSCs (C) and E12.5 FL HSCs (D), (E) Repopulation of MCs in PerC of NSG recipients transplanted with E14.5 FL donor MNCs are shown (n=5 and 3 in independent experiment respectively).

